Correction (July 21, 2026): This article now uses the package's authoritative statewide rows throughout. The current row reports 2,446,595 students and a 37,655-student annual decline. The traditional-sector regional calculation separately reports a 137,484-student New York City loss since 2019. Causal, financial, policy and forward-looking claims not established by the enrollment package have been removed.
Part of the New York Enrollment 2026ET series.
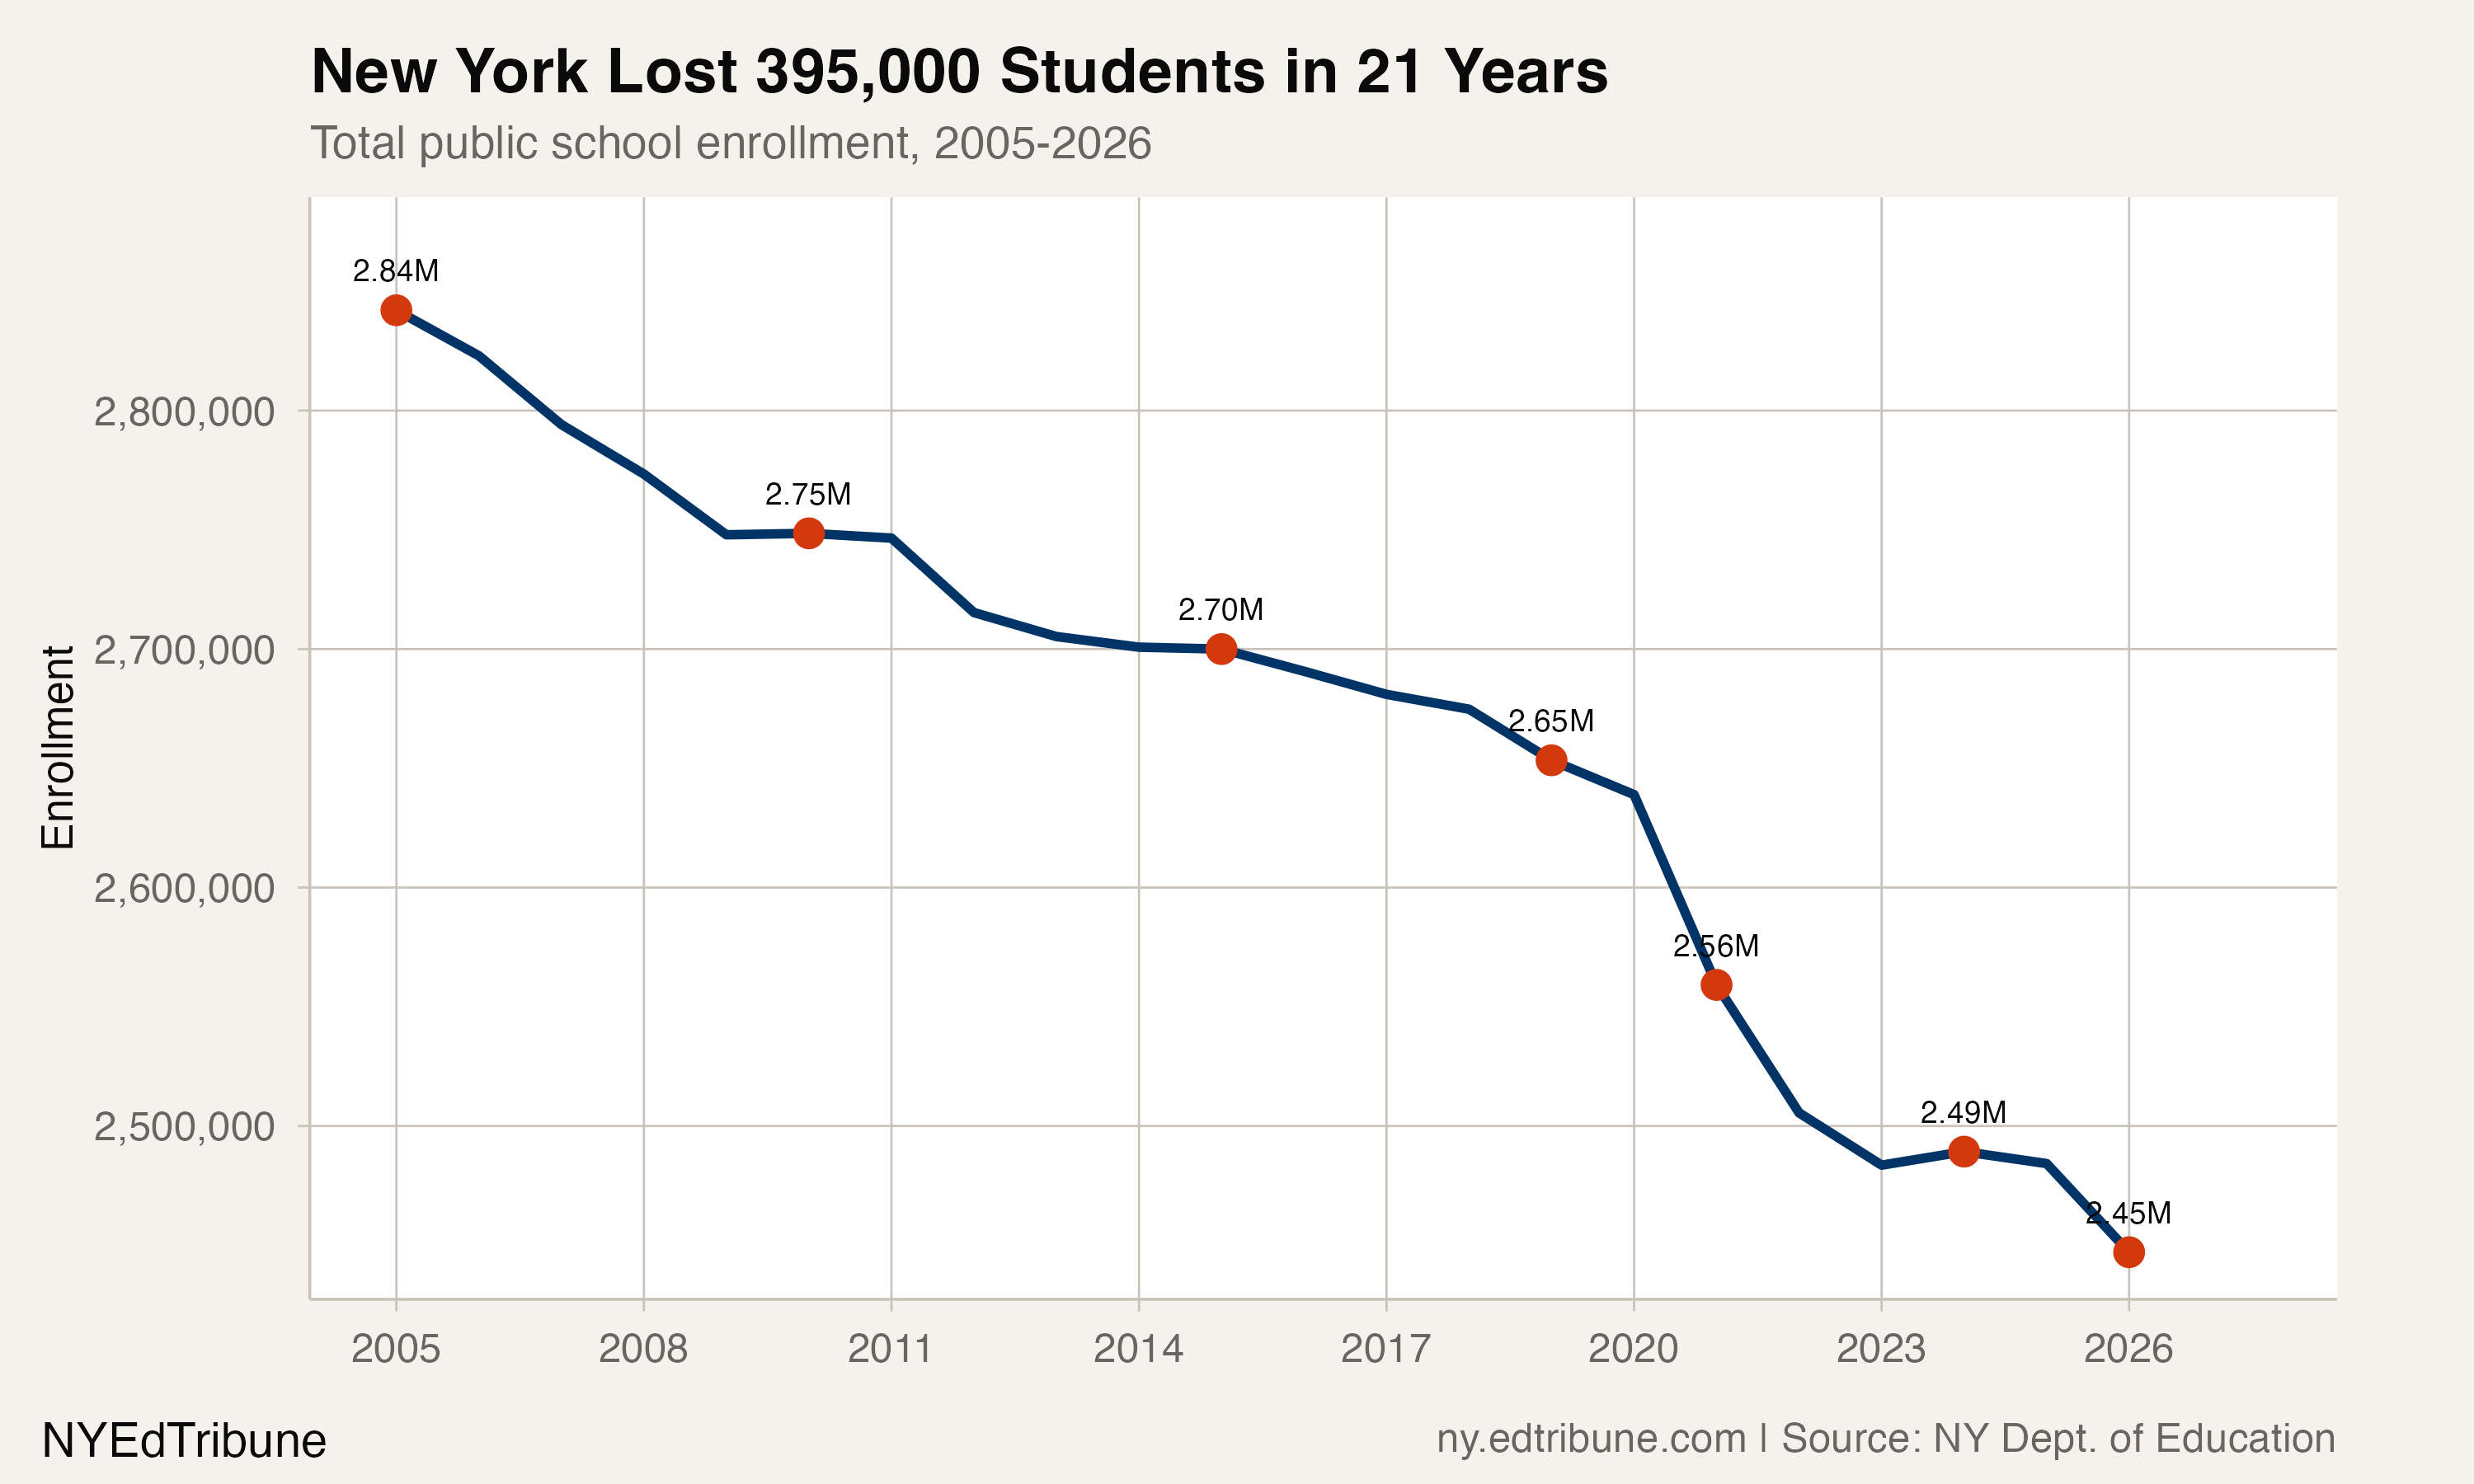
New York public-school enrollment fell from 2,842,058 in 2005 to 2,446,595 in 2026. The 395,463-student decline equals 13.9% of the baseline.
Across 21 annual transitions, enrollment increased twice and declined 19 times. The two increases were 610 students in 2010 and 5,669 in 2024.
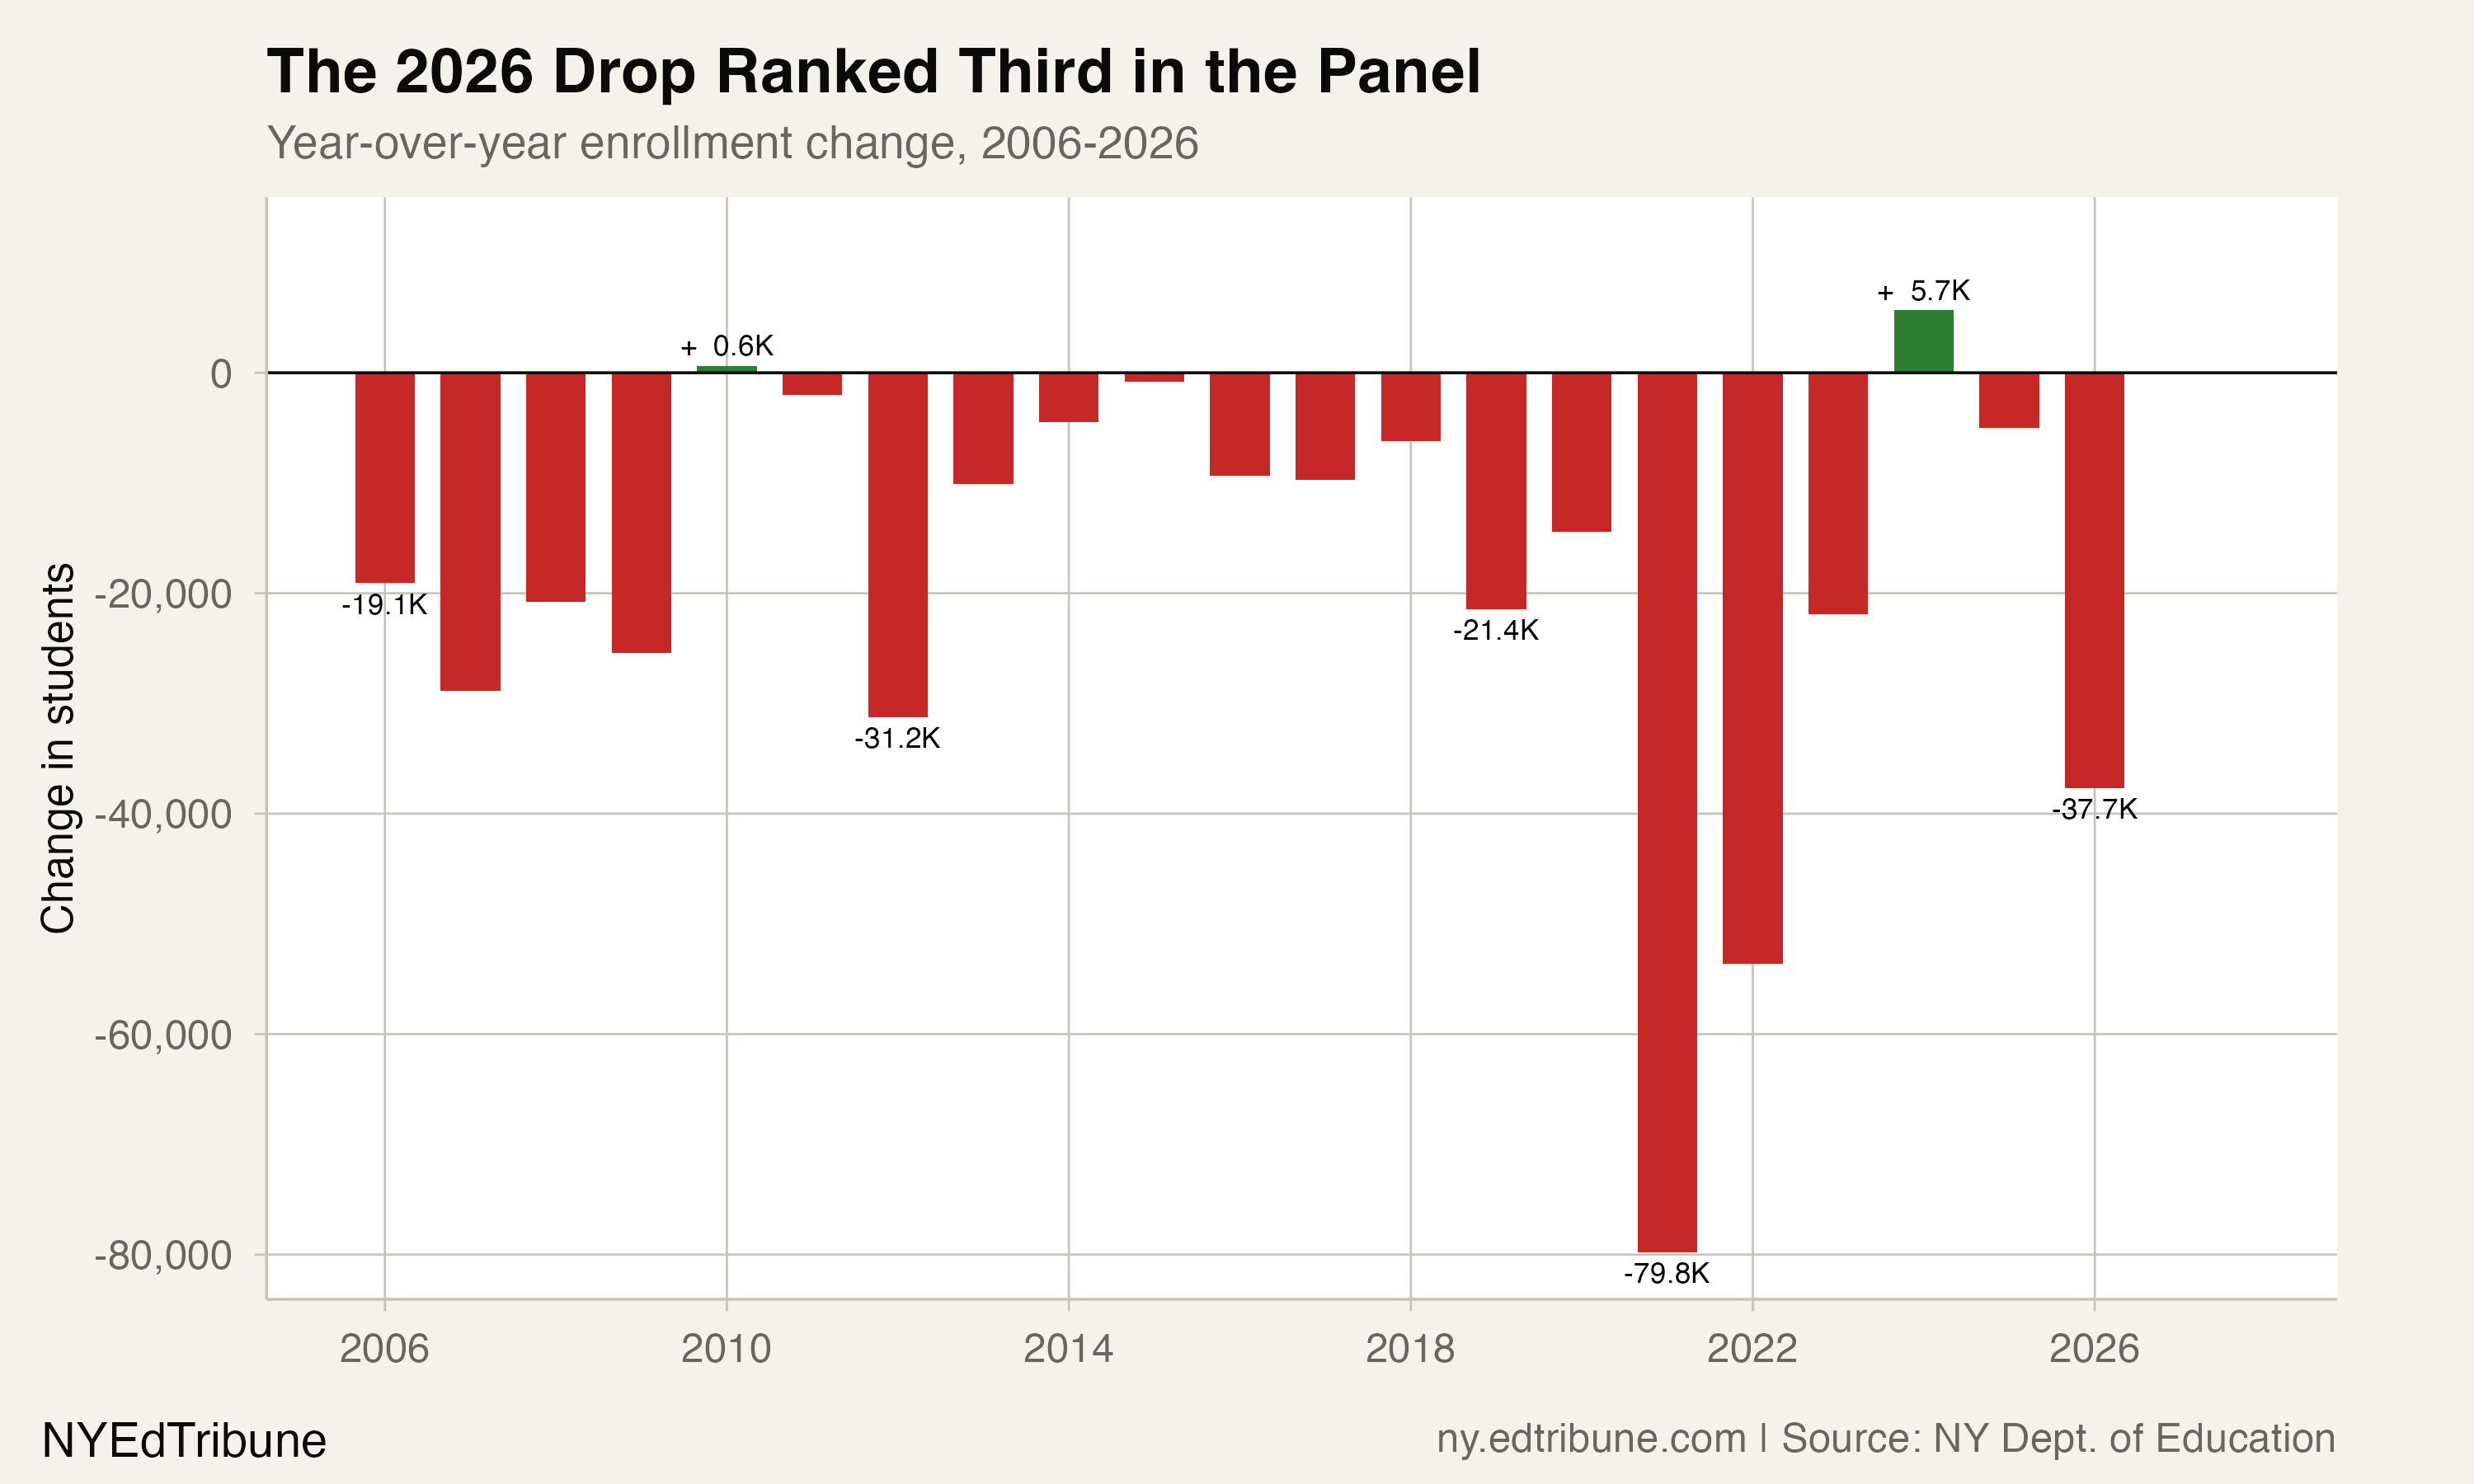
The 2026 loss ranked third in the panel
Enrollment fell 37,655 students in 2026, or 1.5% from 2025. That was the third-largest annual loss in the 2006-2026 panel. The larger losses were 79,785 in 2021 and 53,647 in 2022. The next two were 31,232 in 2012 and 28,849 in 2007.
Compared with 2019 enrollment of 2,653,358, the 2026 total was lower by 206,763 students, or 7.8%.
Four defined periods
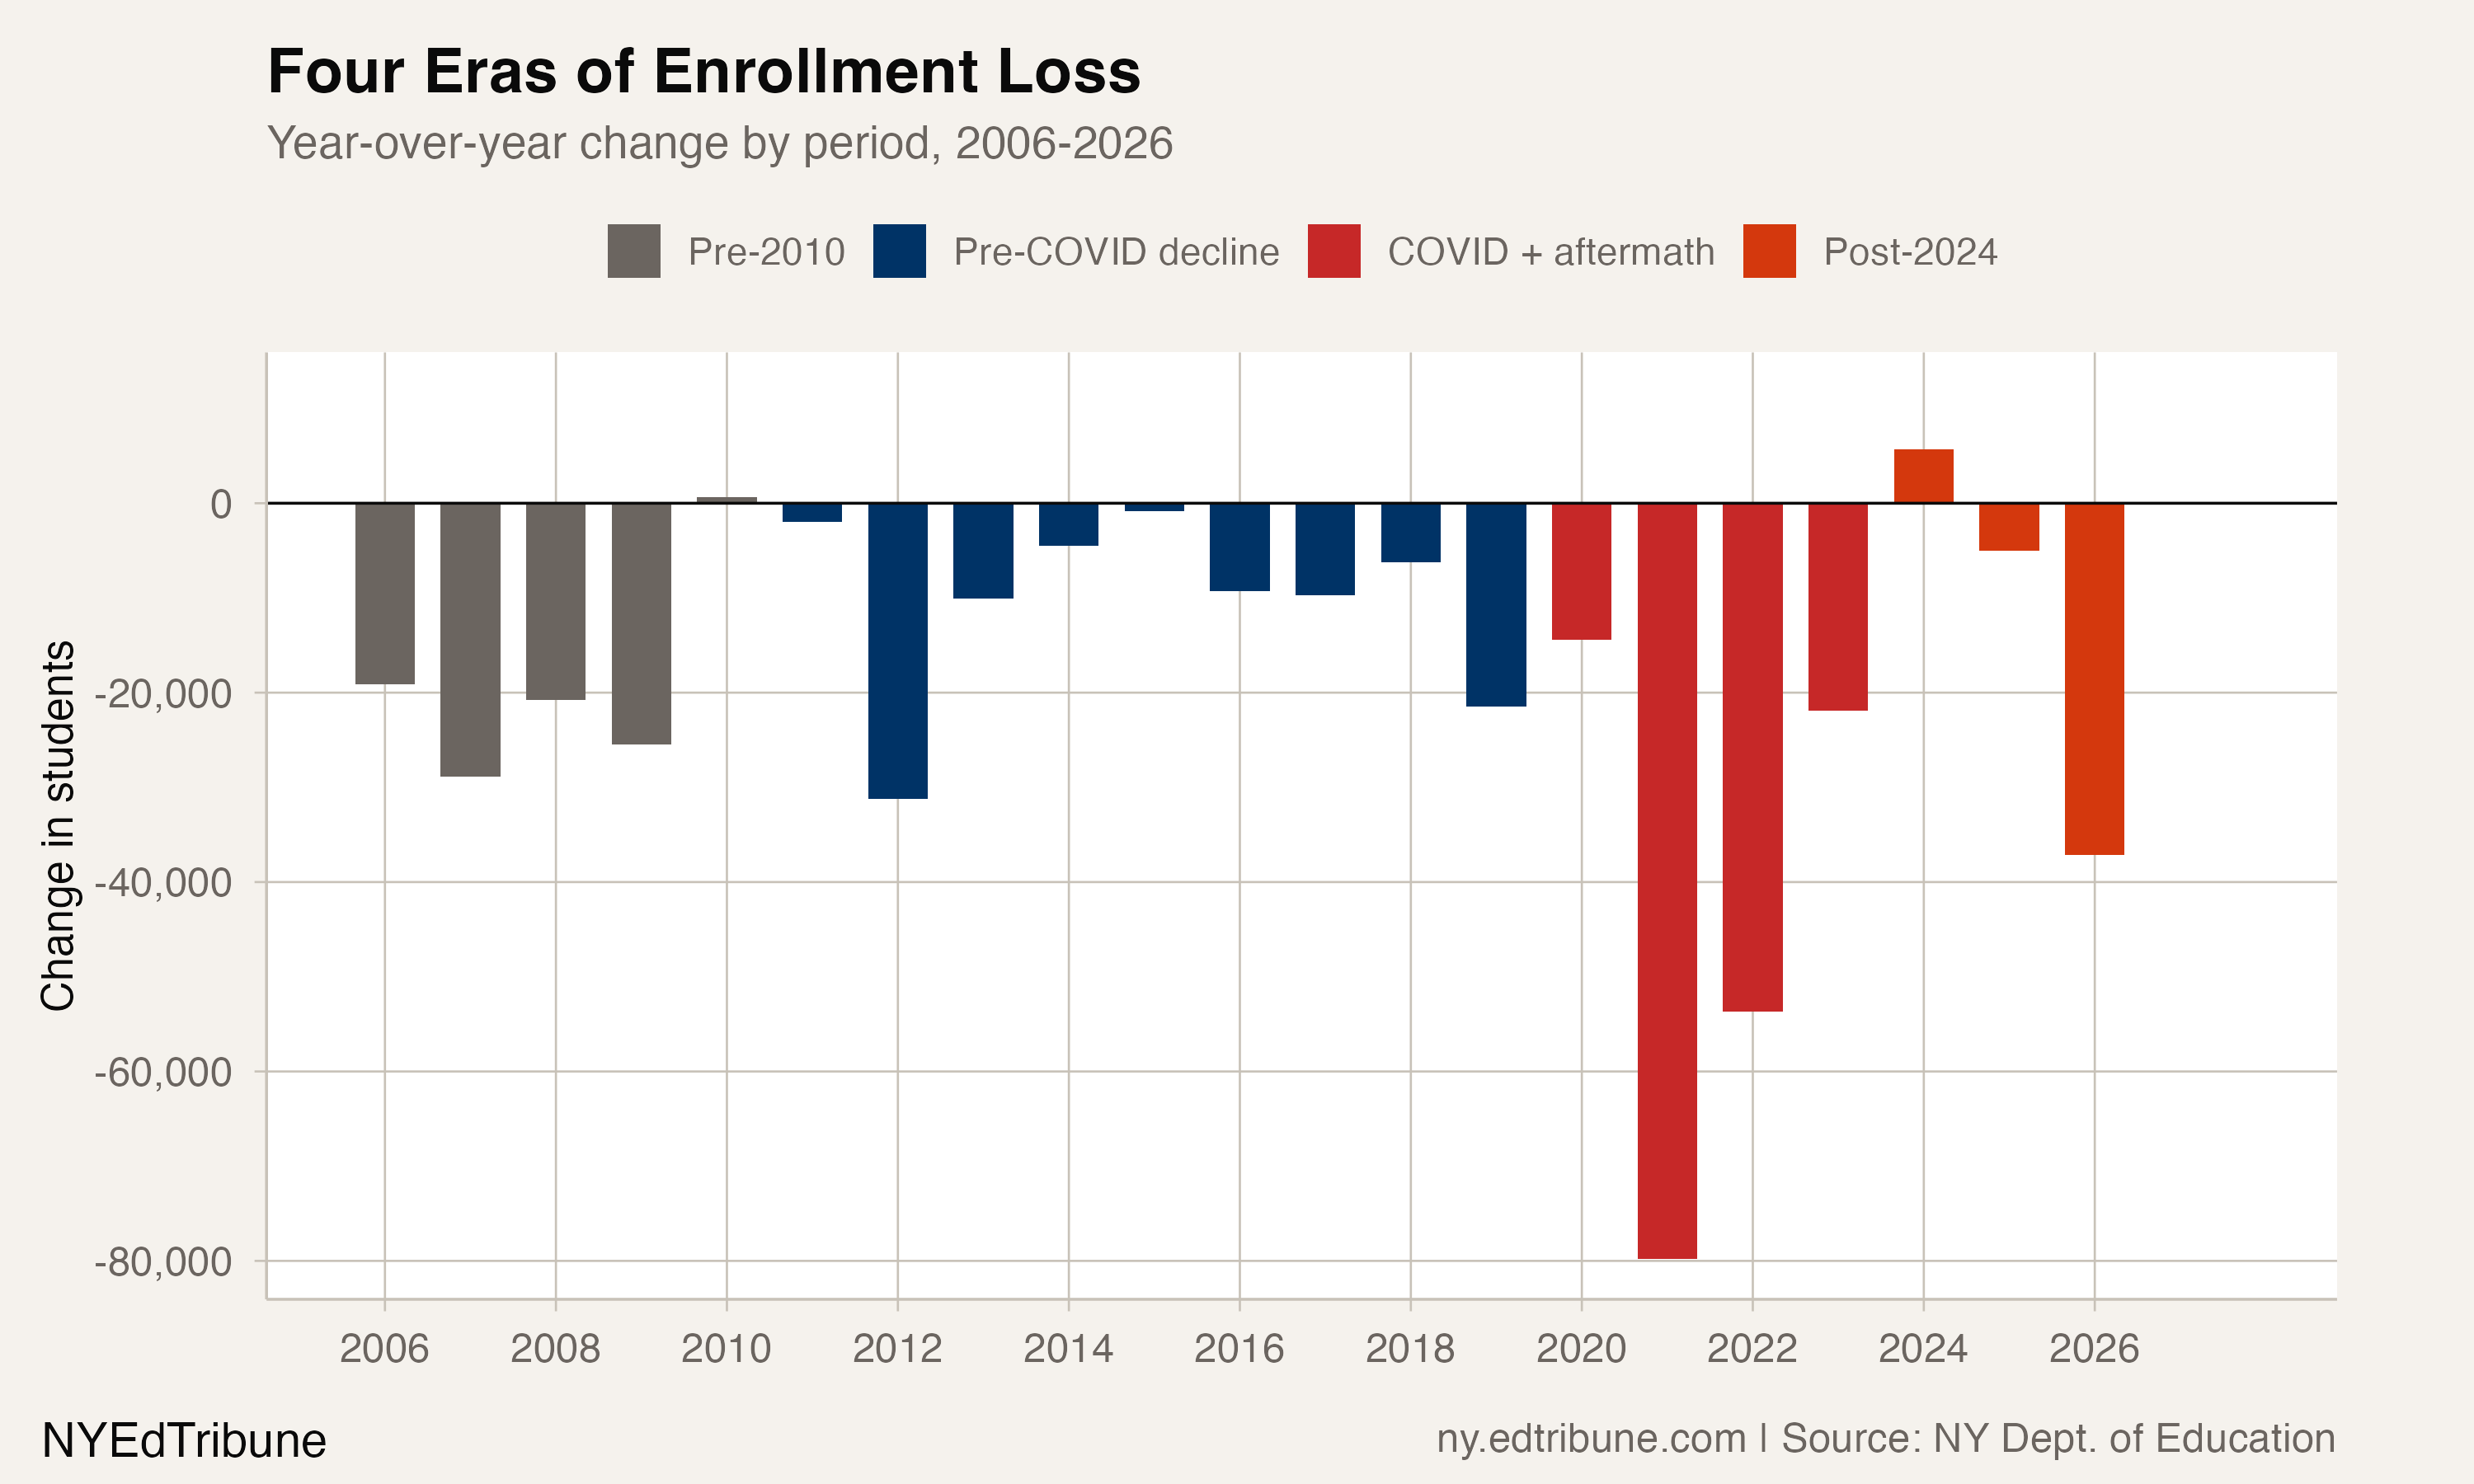
The five transitions from 2006 through 2010 produced a net loss of 93,536 students, averaging 18,707 per year. The nine transitions from 2011 through 2019 lost 95,164, averaging 10,574. Enrollment declined in every transition from 2011 through 2023, a 13-year streak totaling 264,937 students.
The four 2020-2023 transitions lost 169,773 students, averaging 42,443. The three 2024-2026 transitions, including the 2024 increase, had a net loss of 36,990 and an average loss of 12,330.
The 2024 statewide increase split by sector: traditional district rows fell by 269 students while charter district rows gained 5,938, producing the 5,669 net increase.
Kindergarten fell below Grade 12
In 2005, the statewide rows reported 188,810 kindergartners and 167,259 twelfth-graders, a kindergarten-to-Grade-12 ratio of 112.9. In 2026, kindergarten enrollment was 163,754 and Grade 12 enrollment was 187,161, producing a ratio of 87.5.
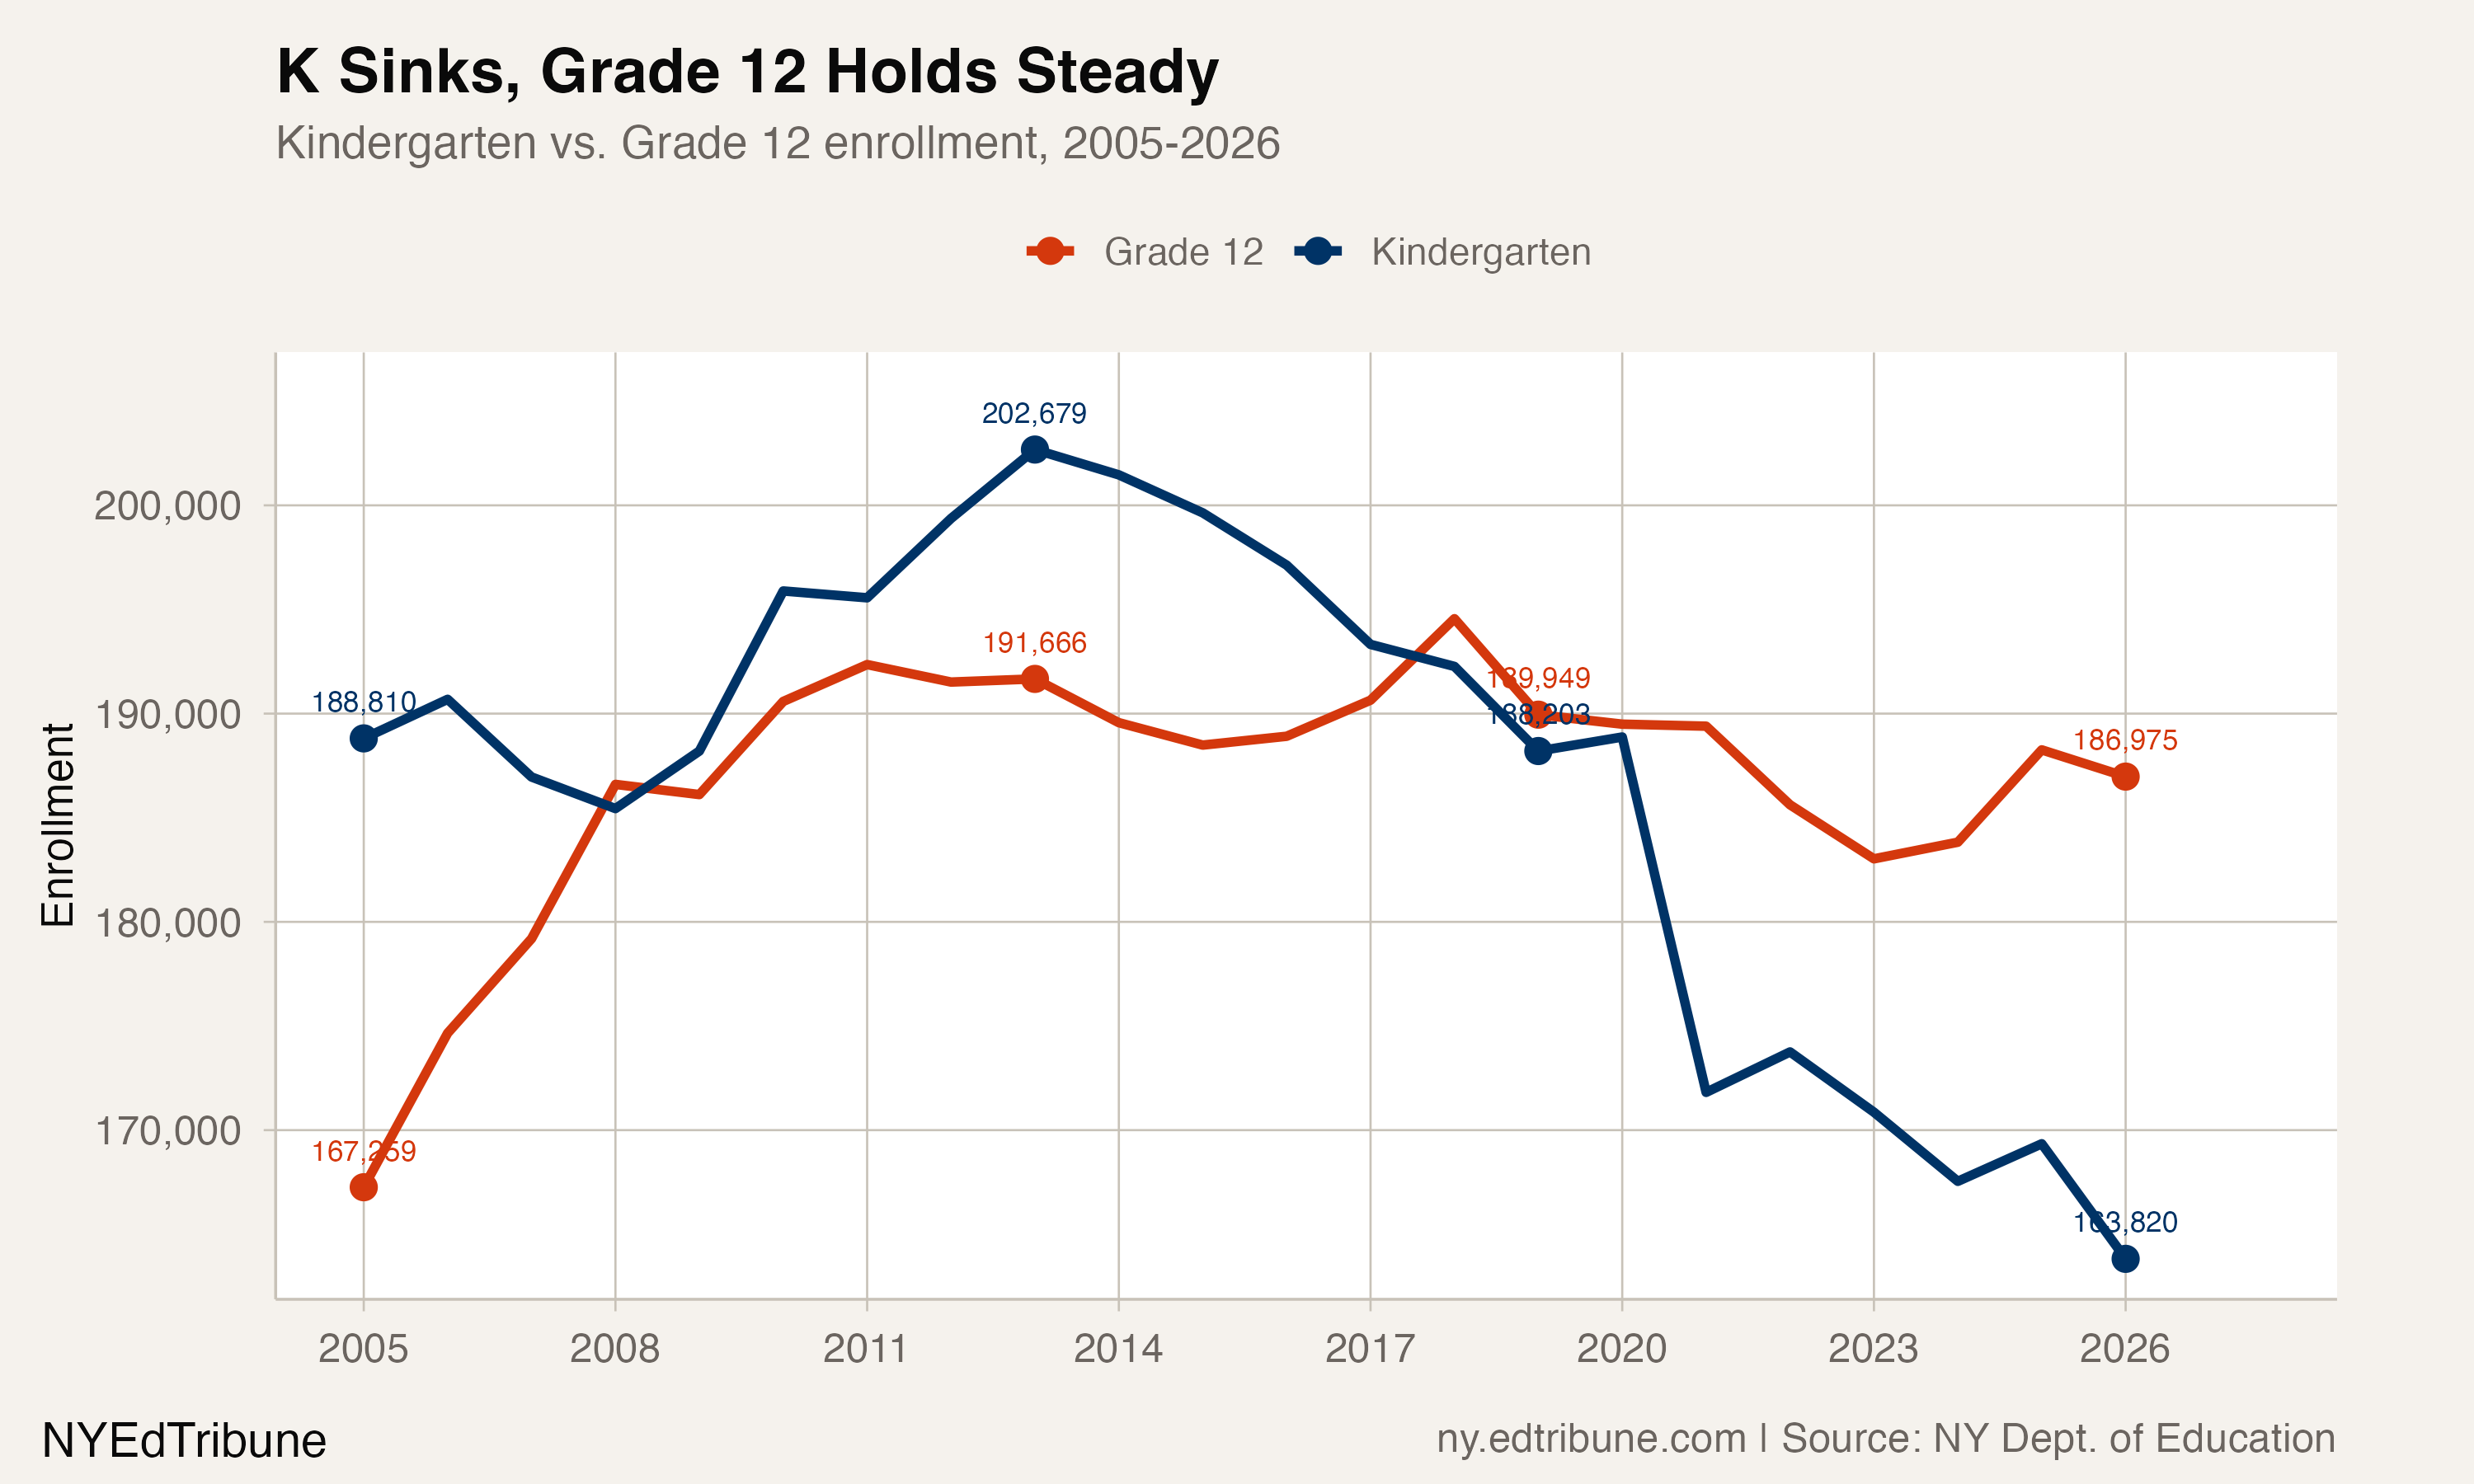
Kindergarten enrollment reached its 22-year panel high of 202,679 in 2013. The 2026 value was 38,925 lower, a 19.2% decline, and was the lowest kindergarten value in the panel. The largest kindergarten annual change highlighted in the analysis was a 17,062-student decline in 2021.
Charter and traditional district rows diverged
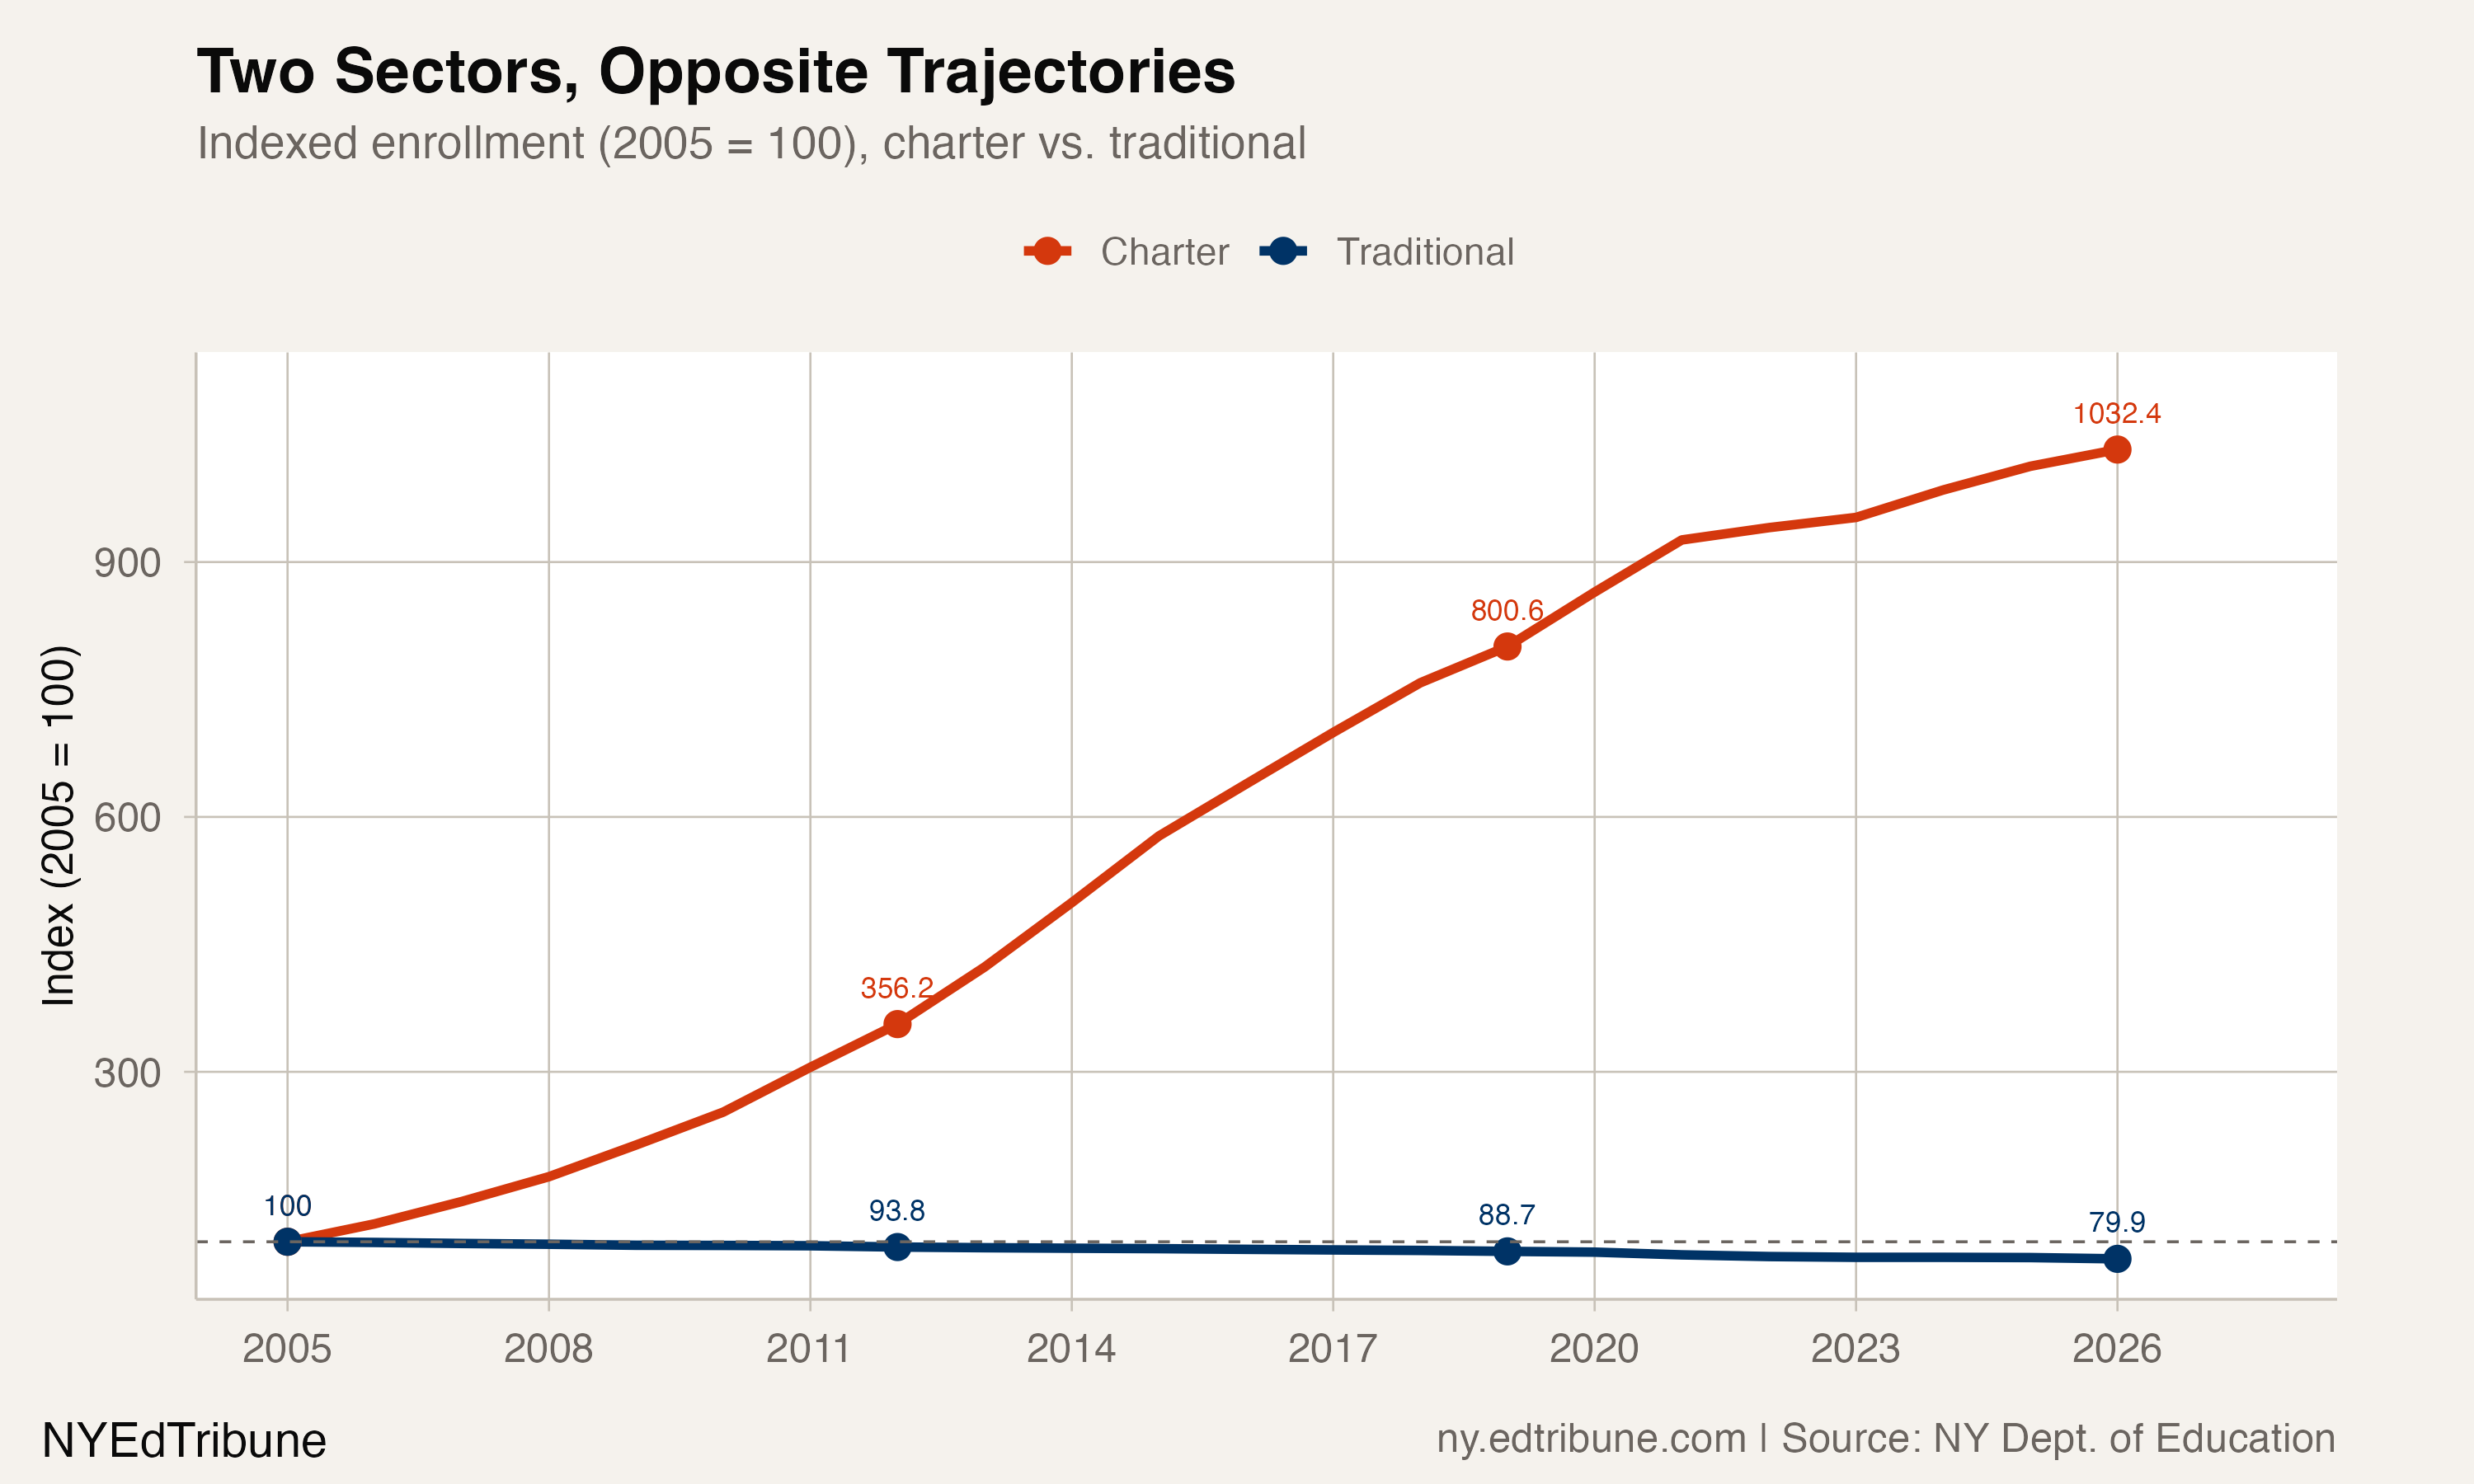
Traditional district-row enrollment fell from 2,823,644 in 2005 to 2,255,993 in 2026. The 567,651-student decline was 20.1%.
Charter district-row enrollment rose from 18,414 to 190,602, a gain of 172,188. That gain equaled 30.3% of the traditional-sector loss. Charter share rose from 0.6% to 7.8%, while the number of charter district rows increased from 61 to 352.
Traditional enrollment since 2019
New York City traditional district rows fell from 948,137 students in 2019 to 810,653 in 2026, a loss of 137,484, or 14.5%. Rest-of-state traditional rows fell from 1,557,793 to 1,445,340, a loss of 112,453, or 7.2%.
Detailed code that reproduces the analysis and figures in this article is available exclusively to EdTribune subscribers.
Discussion
Sign in to join the discussion.
Loading comments...