Part of the New York Enrollment 2026ET series.
For decades, 9th grade was where New York's students got stuck. In 2005, the statewide 9th-grade class contained 264,024 students, 43,949 more than the 8th-grade class of the previous year. That meant roughly one in six freshmen were repeaters, transfers from private schools, or students who had otherwise failed to advance on schedule. The 9th grade wasn't just the start of high school. It was a wall.
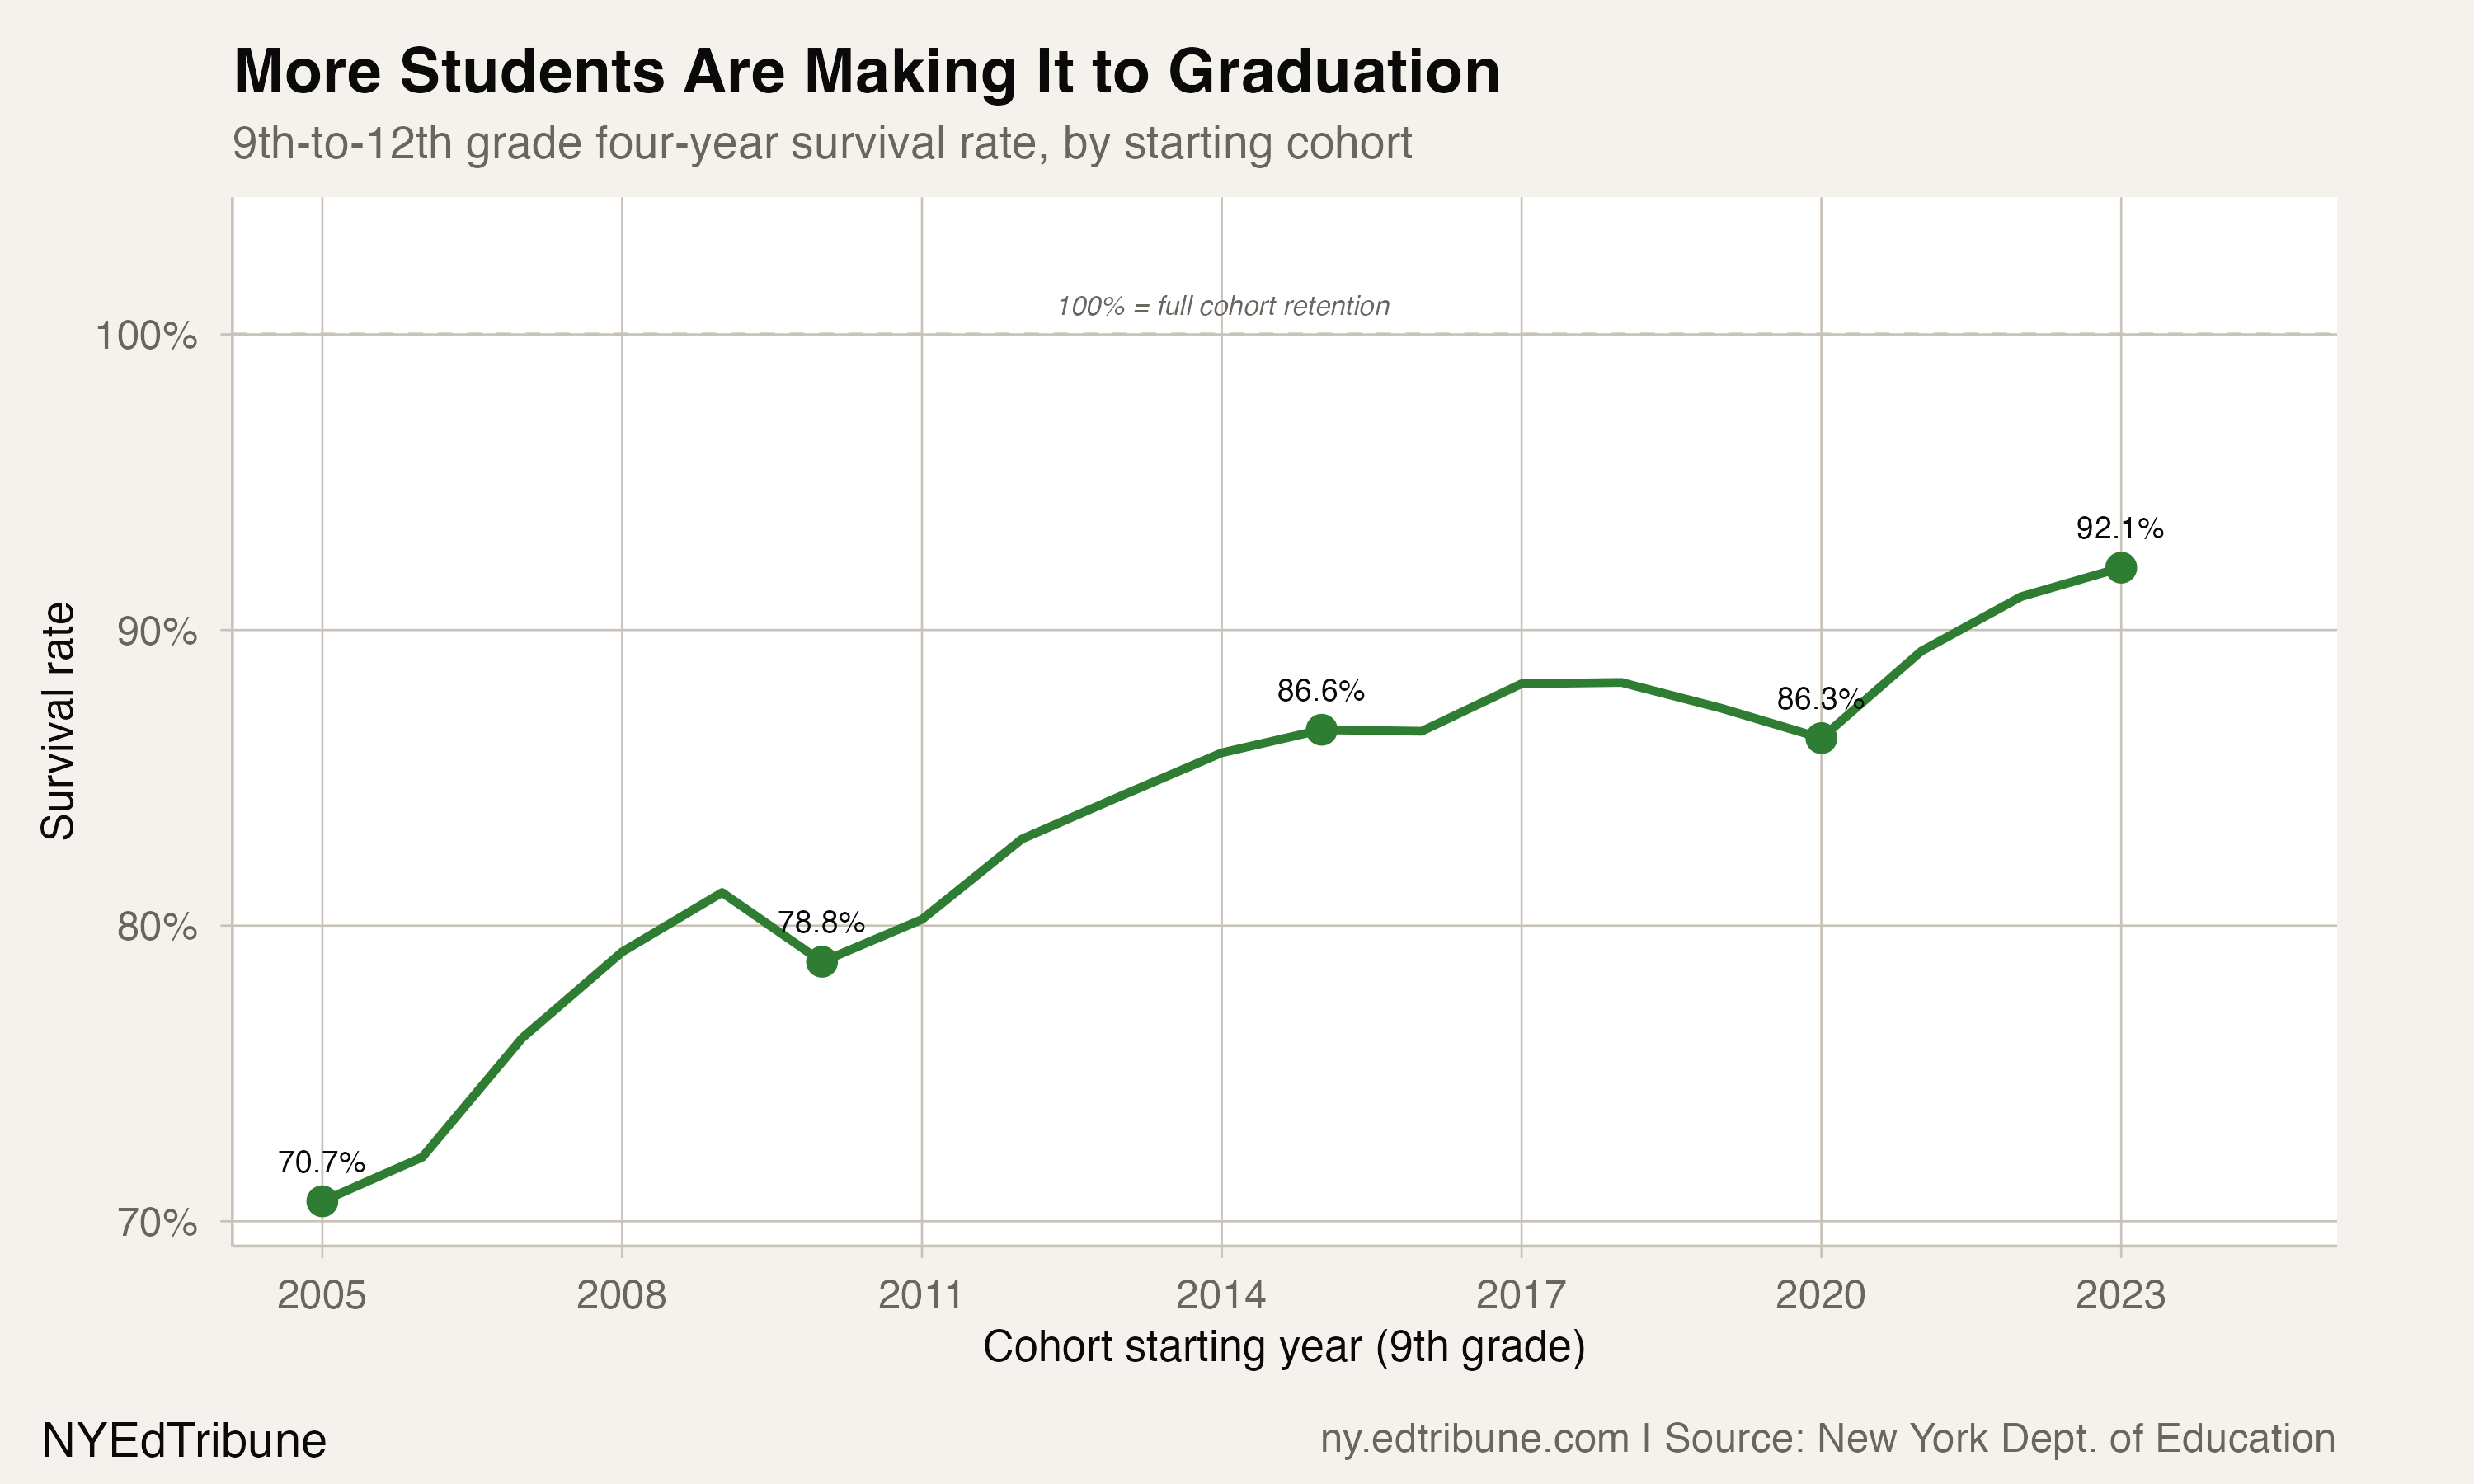
Twenty years later, the wall is mostly gone. In 2026, 9th grade enrolled 196,455 students, just 9,708 more than the prior year's 8th-grade class. The ratio of 9th graders to the preceding 8th-grade cohort fell from 120% to 105%, a quiet revolution in how students move through the system. The four-year survival rate from 9th to 12th grade climbed from 70.7% to 92.1% over the same period. Fewer students are getting held back, and far more are making it to graduation.
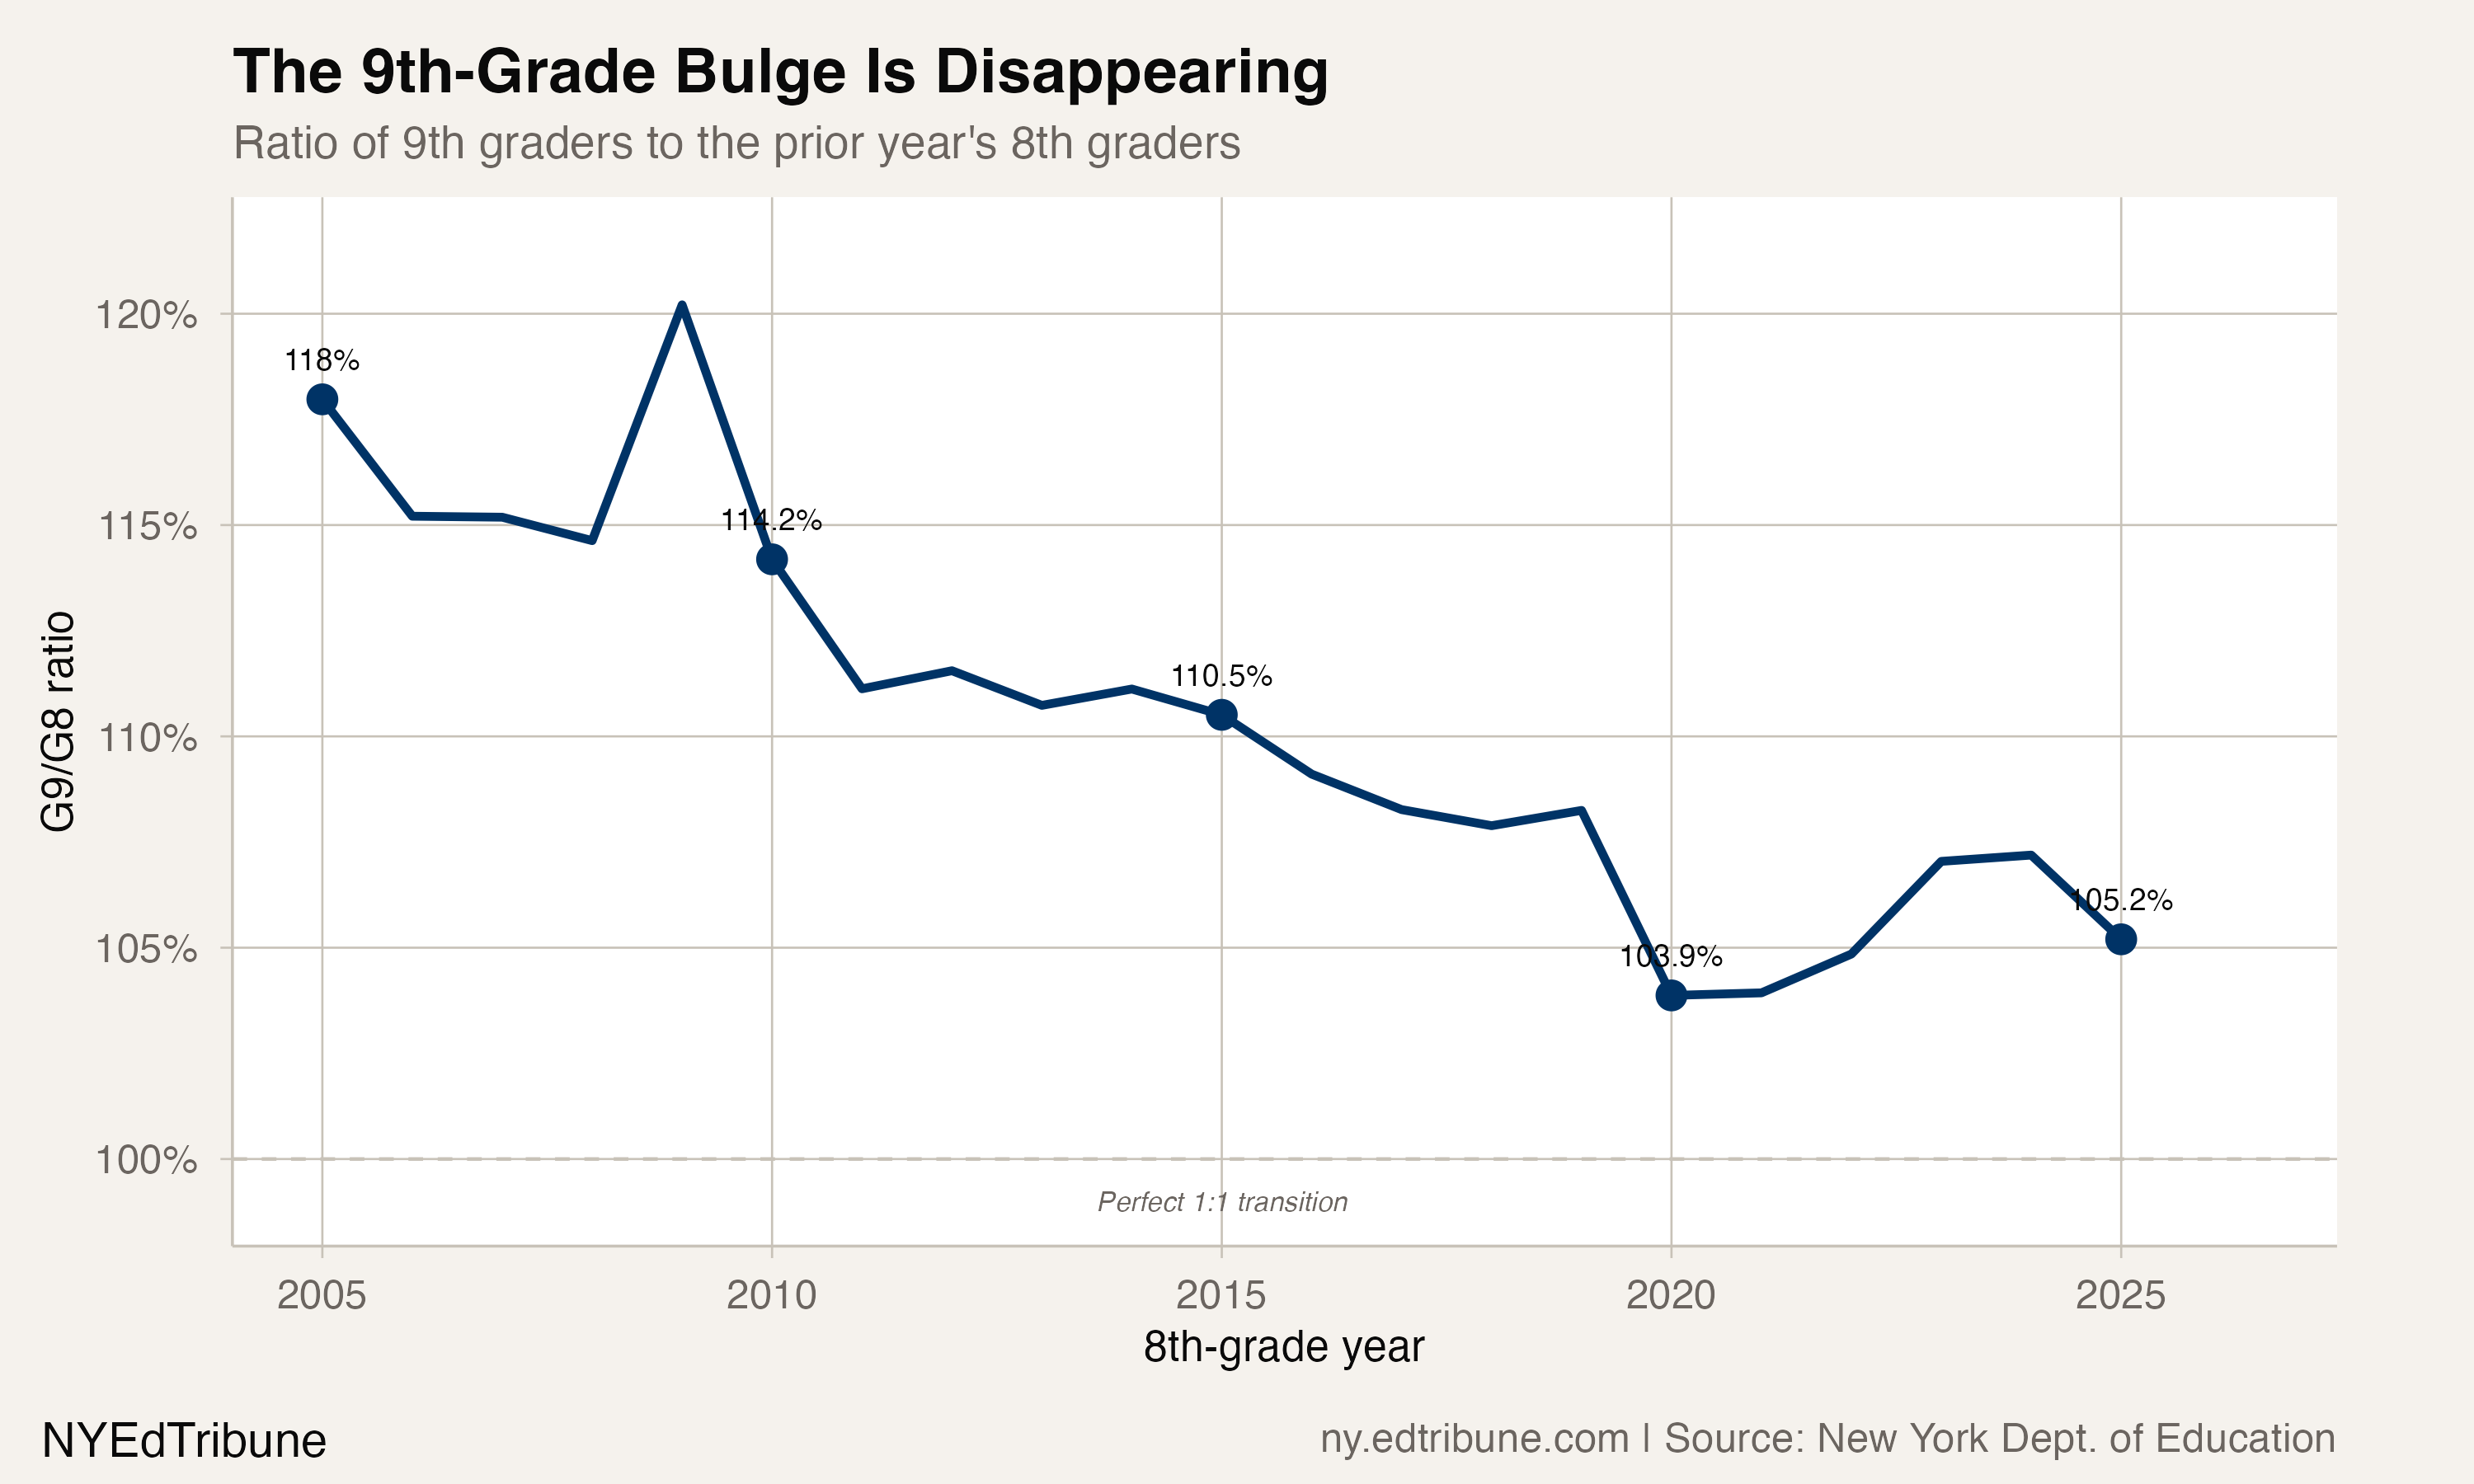
What the "bulge" actually measured
The 9th-grade bulge is a standard enrollment metric: compare how many students enter 9th grade to how many were in 8th grade the year before. A ratio above 100% means students are piling up, mostly from grade retention but also from private-to-public transfers and immigration. In New York, the bulge peaked at 120.2% in 2009, meaning the 9th-grade class was a fifth larger than the 8th-grade class that fed it.
The decline since then has been steep and remarkably steady. The ratio dropped below 110% by 2017, below 105% by 2021, and sat at 105.2% in 2025. In absolute terms, the "excess" 9th graders (those beyond a one-to-one transition from 8th grade) fell from 43,949 in 2005 to 9,708 in 2025. That is 34,241 fewer students stuck at the threshold of high school.
The causes are structural, not accidental. Beginning in 2002, New York City closed 31 large, failing high schools and opened more than 200 new small schools of choice, funded in part by $150 million from the Gates Foundation. The small-schools reform raised graduation rates by 9.5 percentage points among the most disadvantaged students. Citywide, the four-year graduation rate climbed from 54% in 2004 to 80% in 2018.
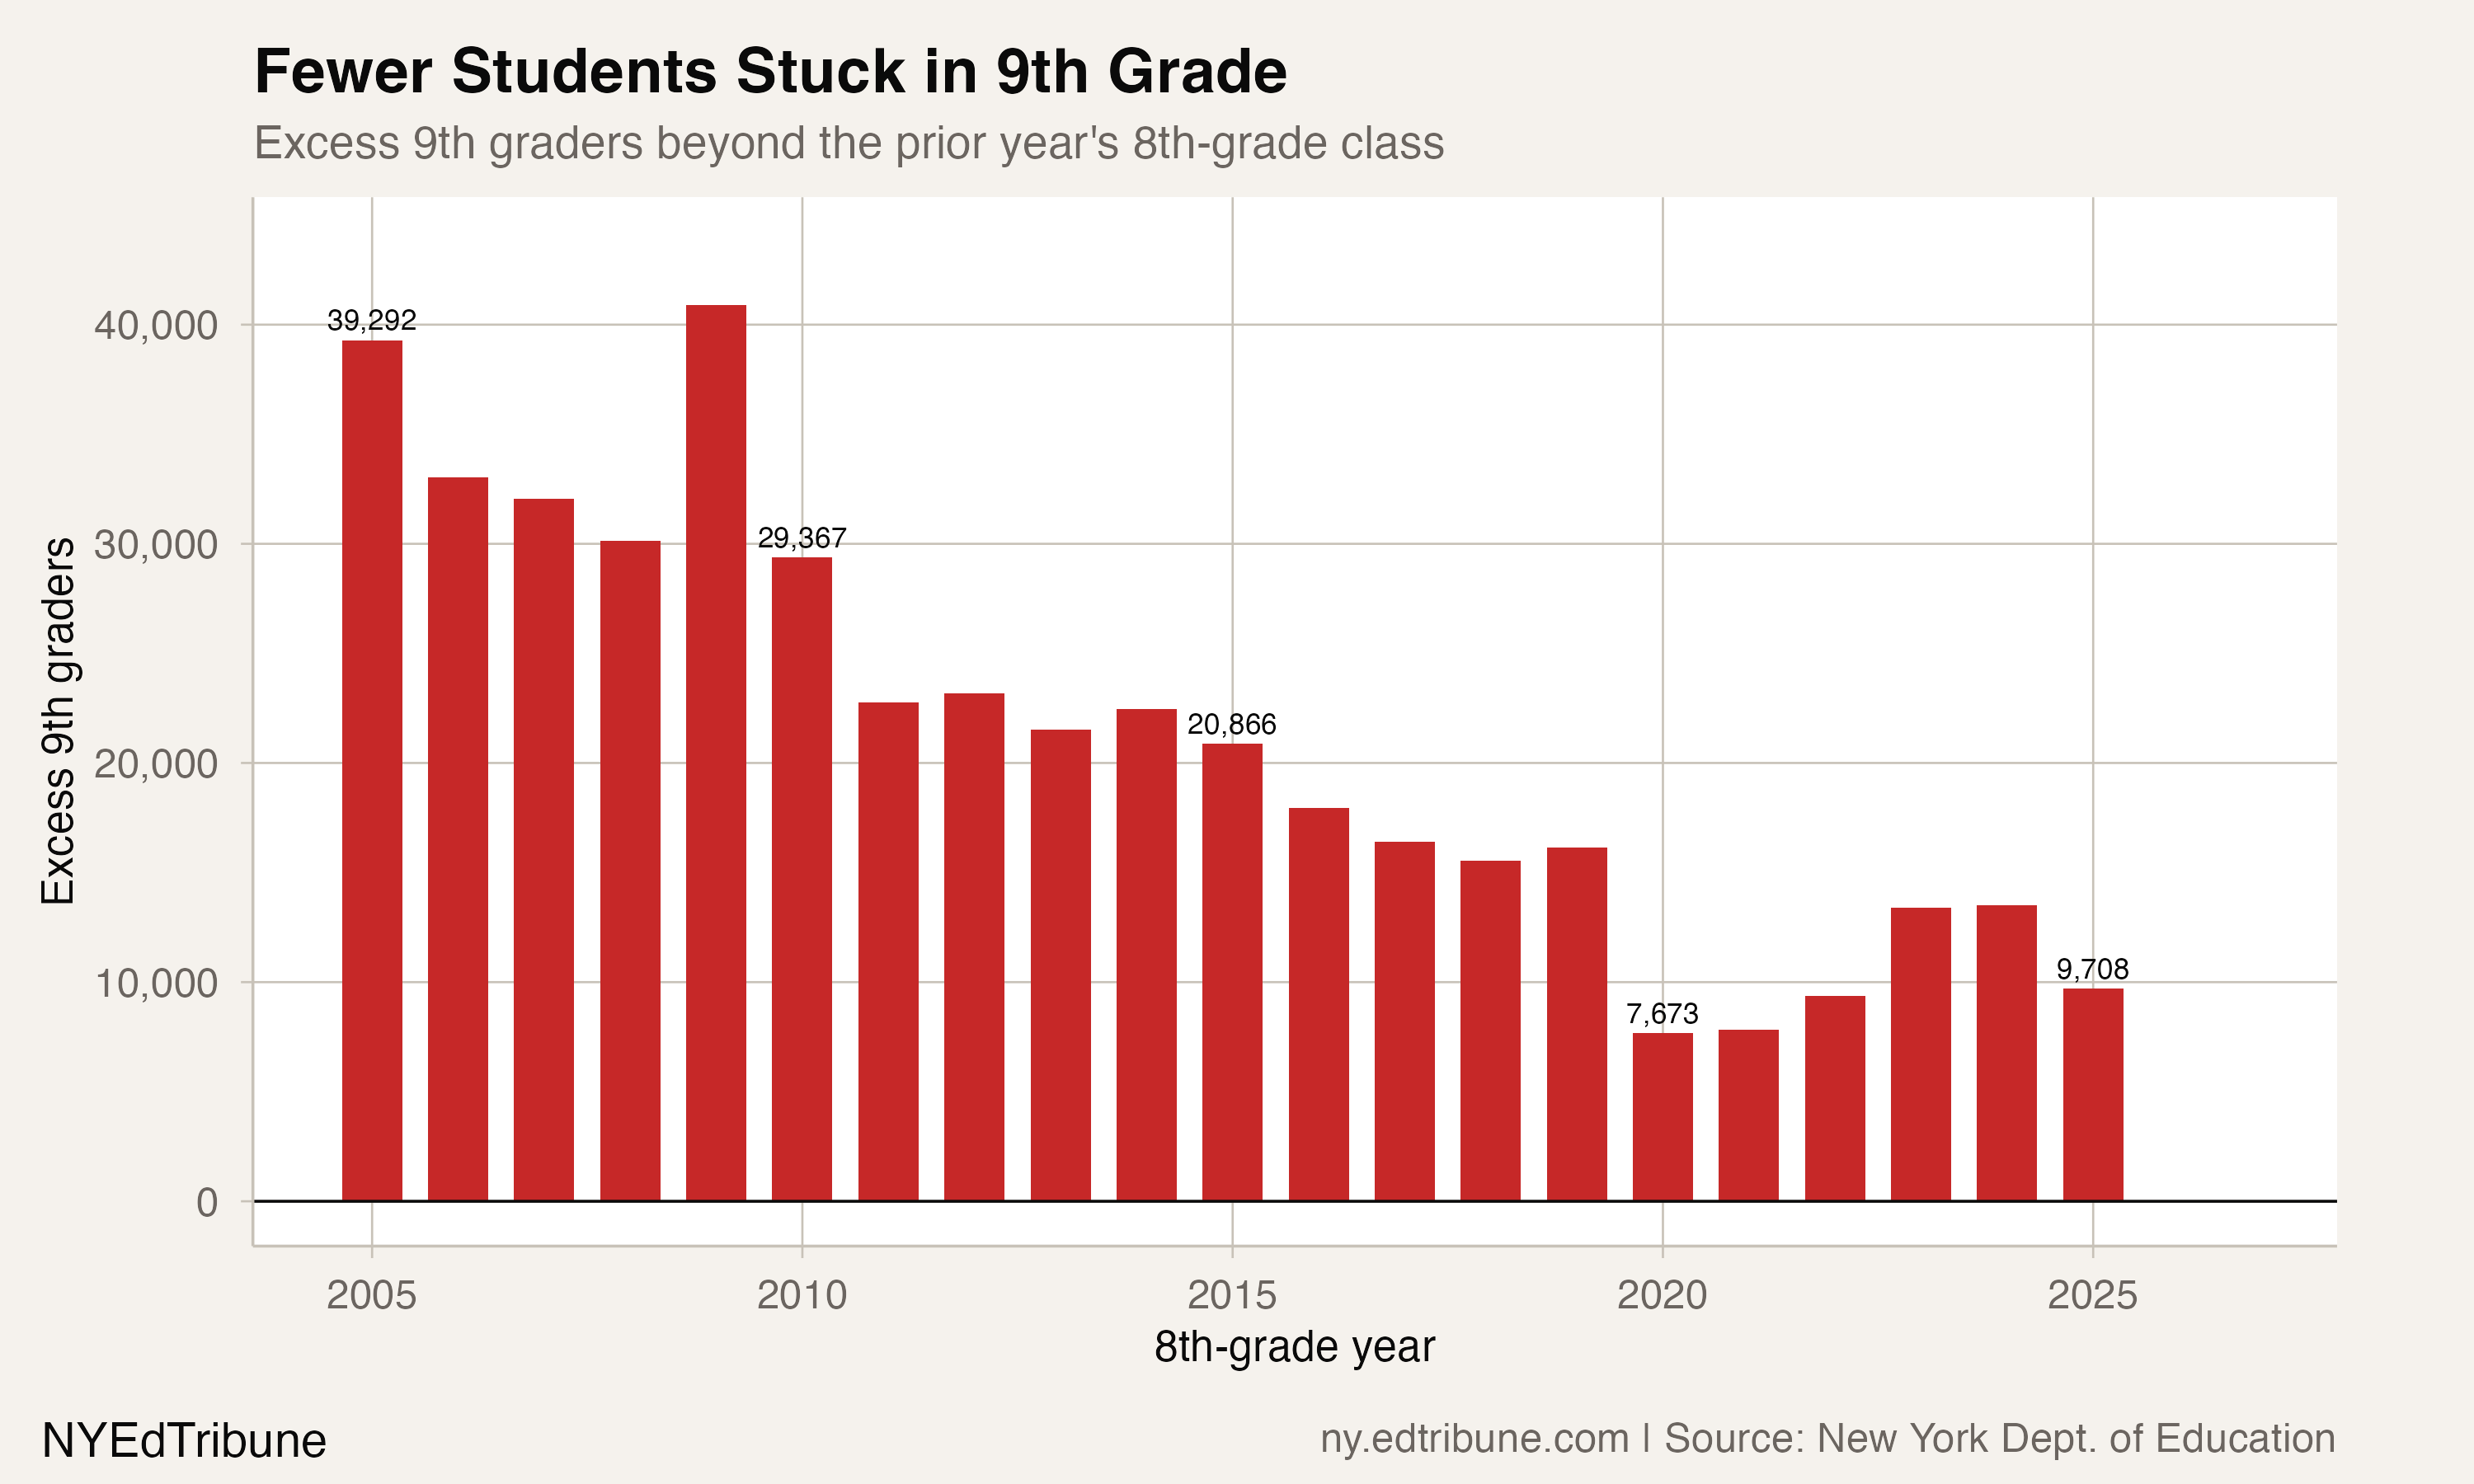
From bottleneck to throughput
The survival rate tells the completion side of the story. Track a 9th-grade cohort forward three years and count how many show up as 12th graders. In 2005, only 70.7% of the 264,024 freshmen appeared as seniors in 2008, meaning roughly 77,000 students vanished between entry and exit. By the 2023 cohort, 92.1% of 9th graders made it to 12th grade three years later. The improvement crossed 90% for the first time with the 2022 cohort.
The improvement came from both ends. The denominator shrank: 9th-grade enrollment fell 25.6% from 264,024 to 196,455 as fewer students repeated the grade. And the numerator held firm: 12th-grade enrollment barely changed, from 186,601 in 2008 to 186,975 in 2026, despite overall enrollment falling by nearly 400,000 students.
The senior-year dropout rate collapsed in parallel. In 2005, 5.1% of 11th graders failed to appear as 12th graders the following year. By 2025, that attrition had fallen to 0.8%. In some recent years it has gone negative: more students appeared in 12th grade than were in 11th the year before, likely reflecting students returning to complete their diplomas.
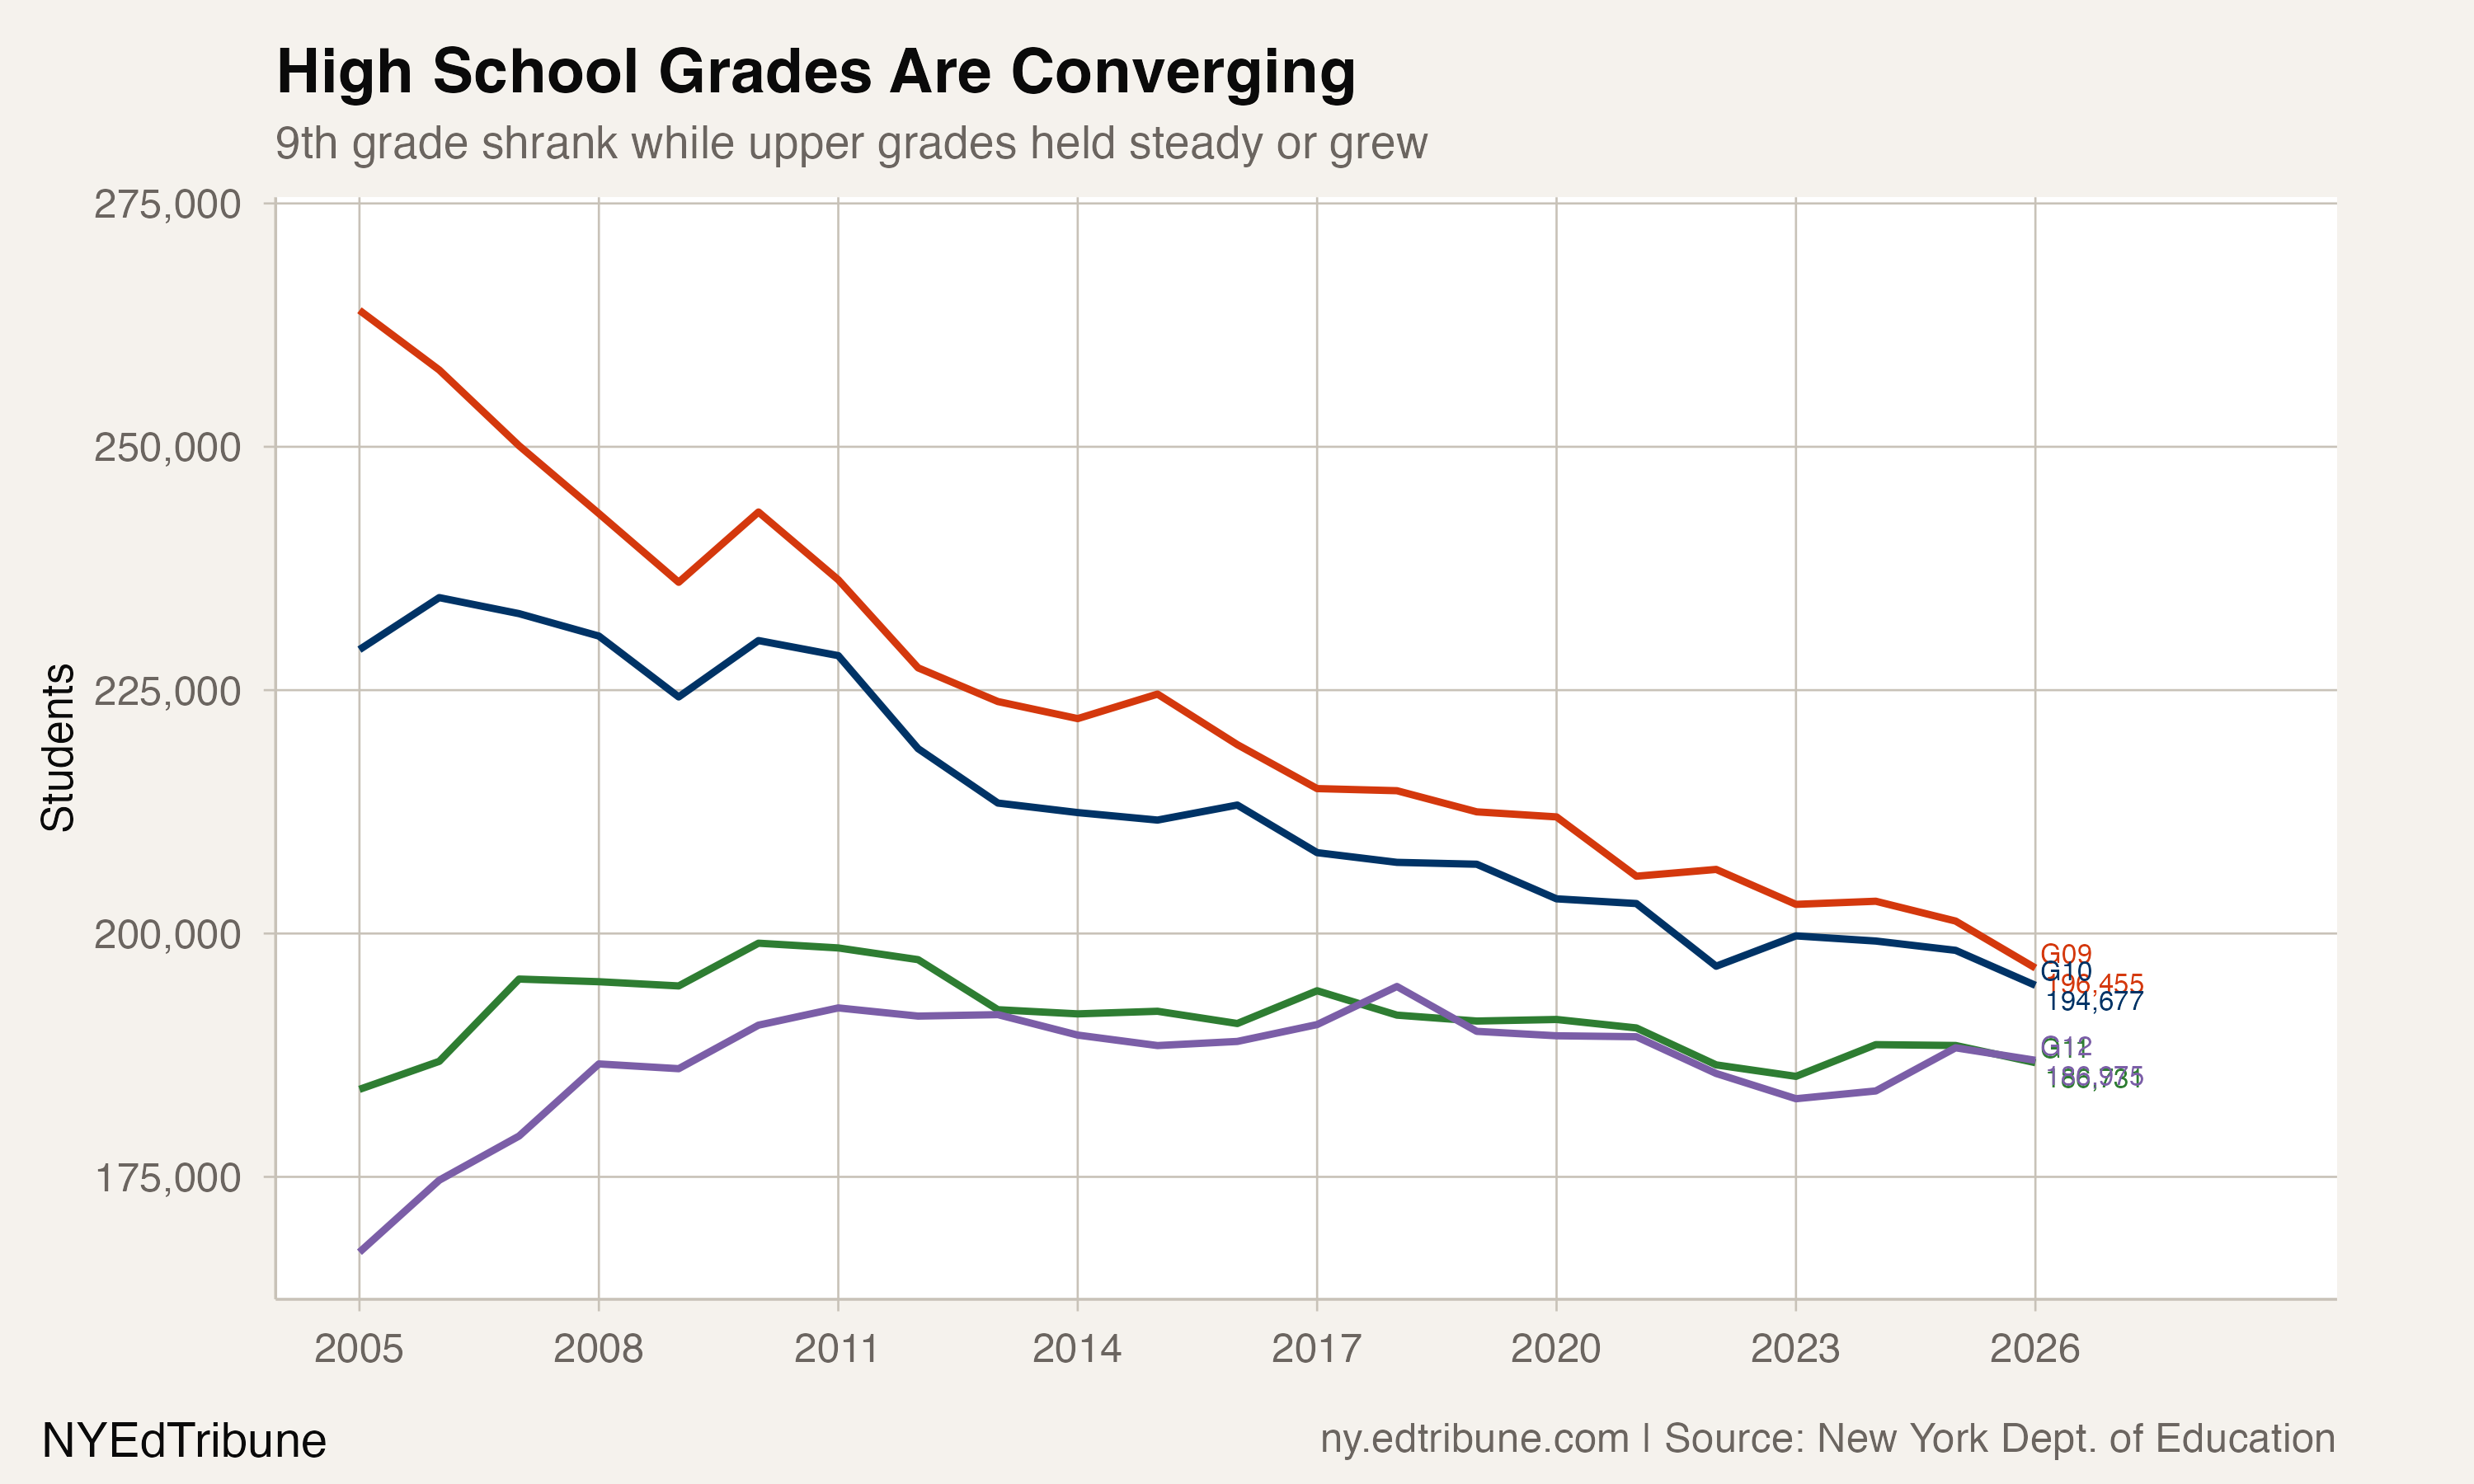
The four high school grades are converging
The practical result is visible in the grade-by-grade enrollment data. In 2005, 9th grade was vastly larger than every other high school grade: 264,024 freshmen versus 229,163 sophomores, 183,989 juniors, and 167,259 seniors. The grades formed a steep pyramid, with each level smaller than the one below.
By 2026, the pyramid has nearly flattened. Grade 9 enrolled 196,455, grade 10 had 194,677, grade 11 held 186,731, and grade 12 reached 186,975. The gap between the largest and smallest high school grade shrank from 96,765 students in 2005 to 9,480 in 2026. Ninth grade's share of total high school enrollment fell from 31.3% to 25.7%, much closer to the 25% it would represent in a perfectly balanced system.
This convergence is a sign of health. When 9th grade is bloated, it means resources are being consumed by students repeating material, classrooms are overcrowded at the entry point, and the system is failing its most vulnerable students at the worst possible moment. A flatter distribution means students are progressing through the pipeline instead of clogging it.
NYC drove the improvement, but still lags
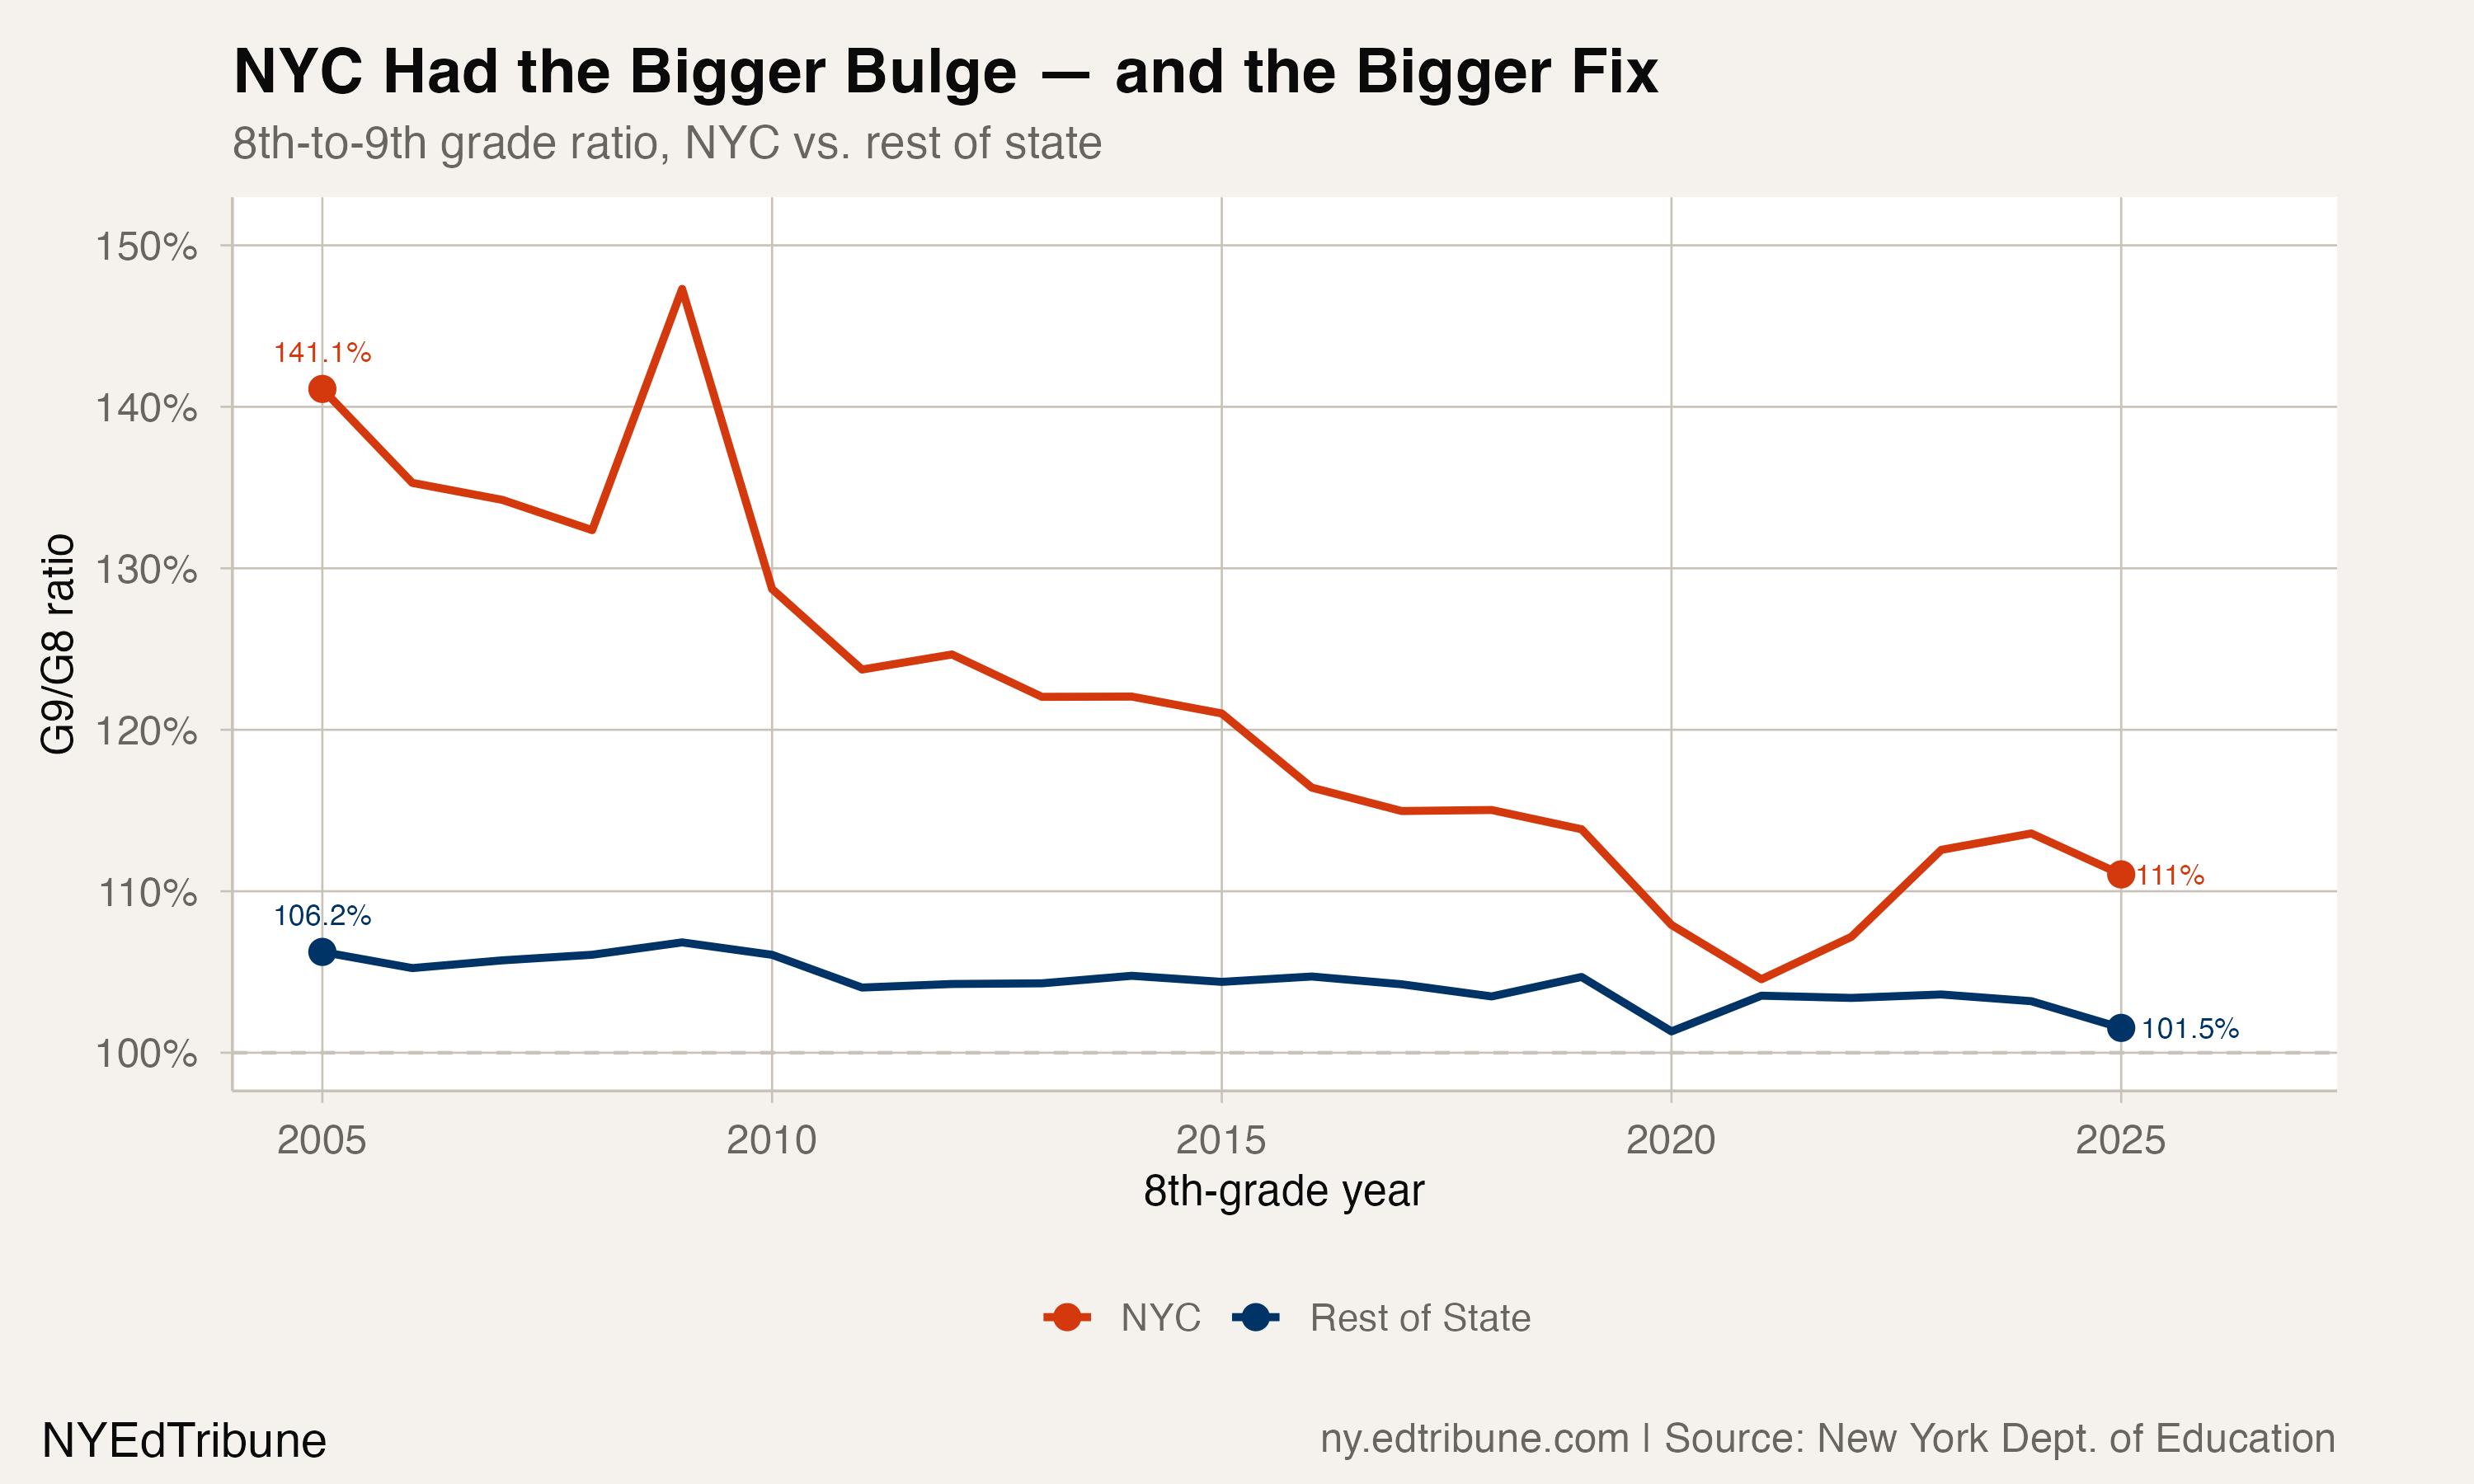
The 9th-grade bulge was always primarily a New York City phenomenon. In 2005, the city's 8th-to-9th ratio was 141.1%, meaning the city's 9th-grade class was 41% larger than the 8th-grade class that preceded it. The rest of the state was 106.2%, a modest bulge by comparison.
By 2025, NYC had brought its ratio down to 111.0%, a 30-percentage-point improvement. The rest of the state fell to 101.5%, nearly a perfect one-to-one transition. The city's improvement was dramatic, but it still carries a bulge roughly seven times larger than upstate and suburban districts.
The city's remaining bulge is concentrated in specific geographic districts. NYC District 2 (Manhattan)↗ET, which contains many specialized and selective high schools that draw from across the city, had a ratio of 342% in 2025, meaning its 9th-grade class was more than triple its 8th-grade class. District 13 (Brooklyn)↗ET was at 477%, and District 26 (Queens)↗ET at 187%. These are not signs of retention; they reflect the city's unique high school choice system, where students apply to schools outside their home district. The bulge is structural rather than pathological.
Outside the city, the few remaining high-bulge districts are small. Schenectady↗ET showed a 141% ratio in 2025, and East Hampton was at 189%, the latter likely reflecting seasonal population dynamics. Statewide, only 59 districts with 100 or more 8th graders had bulges exceeding 10% in 2025, down from 140 districts in 2005.
A success story inside a decline story
New York's enrollment has fallen in 19 of the last 21 years, losing nearly 400,000 students since 2005. Every week brings new coverage of closing schools, shrinking budgets, and demographic headwinds. But the 9th-grade data tells a different story, one where the system got measurably better at its core function of moving students from entry to graduation.
The improvement is not trivial. In 2005, roughly 44,000 students were stuck in a 9th-grade bottleneck; by 2025, that number was under 10,000. The four-year survival rate gained 21.4 percentage points. The senior-year dropout rate fell by more than 80%. These are outcomes that matter to individual students and families in ways that statewide enrollment totals do not.
The gains are also fragile. The survival rate dipped during the pandemic years (the 2020 cohort's rate fell to 86.3% before recovering), and the 2023 cohort's recovery to 92.1% has not yet been tested by the immigration disruptions and budget pressures that hit in 2025 and 2026. Whether the system can maintain its throughput improvements while losing students and resources remains an open question.
But for now, the data is clear: New York is graduating a larger share of its students from high school than at any point in its recent history, even as the total number of students shrinks. Fewer are getting stuck. More are getting through.
Detailed code that reproduces the analysis and figures in this article is available exclusively to EdTribune subscribers.
Discussion
Sign in to join the discussion.
Loading comments...