Part of the New York Enrollment 2026ET series.
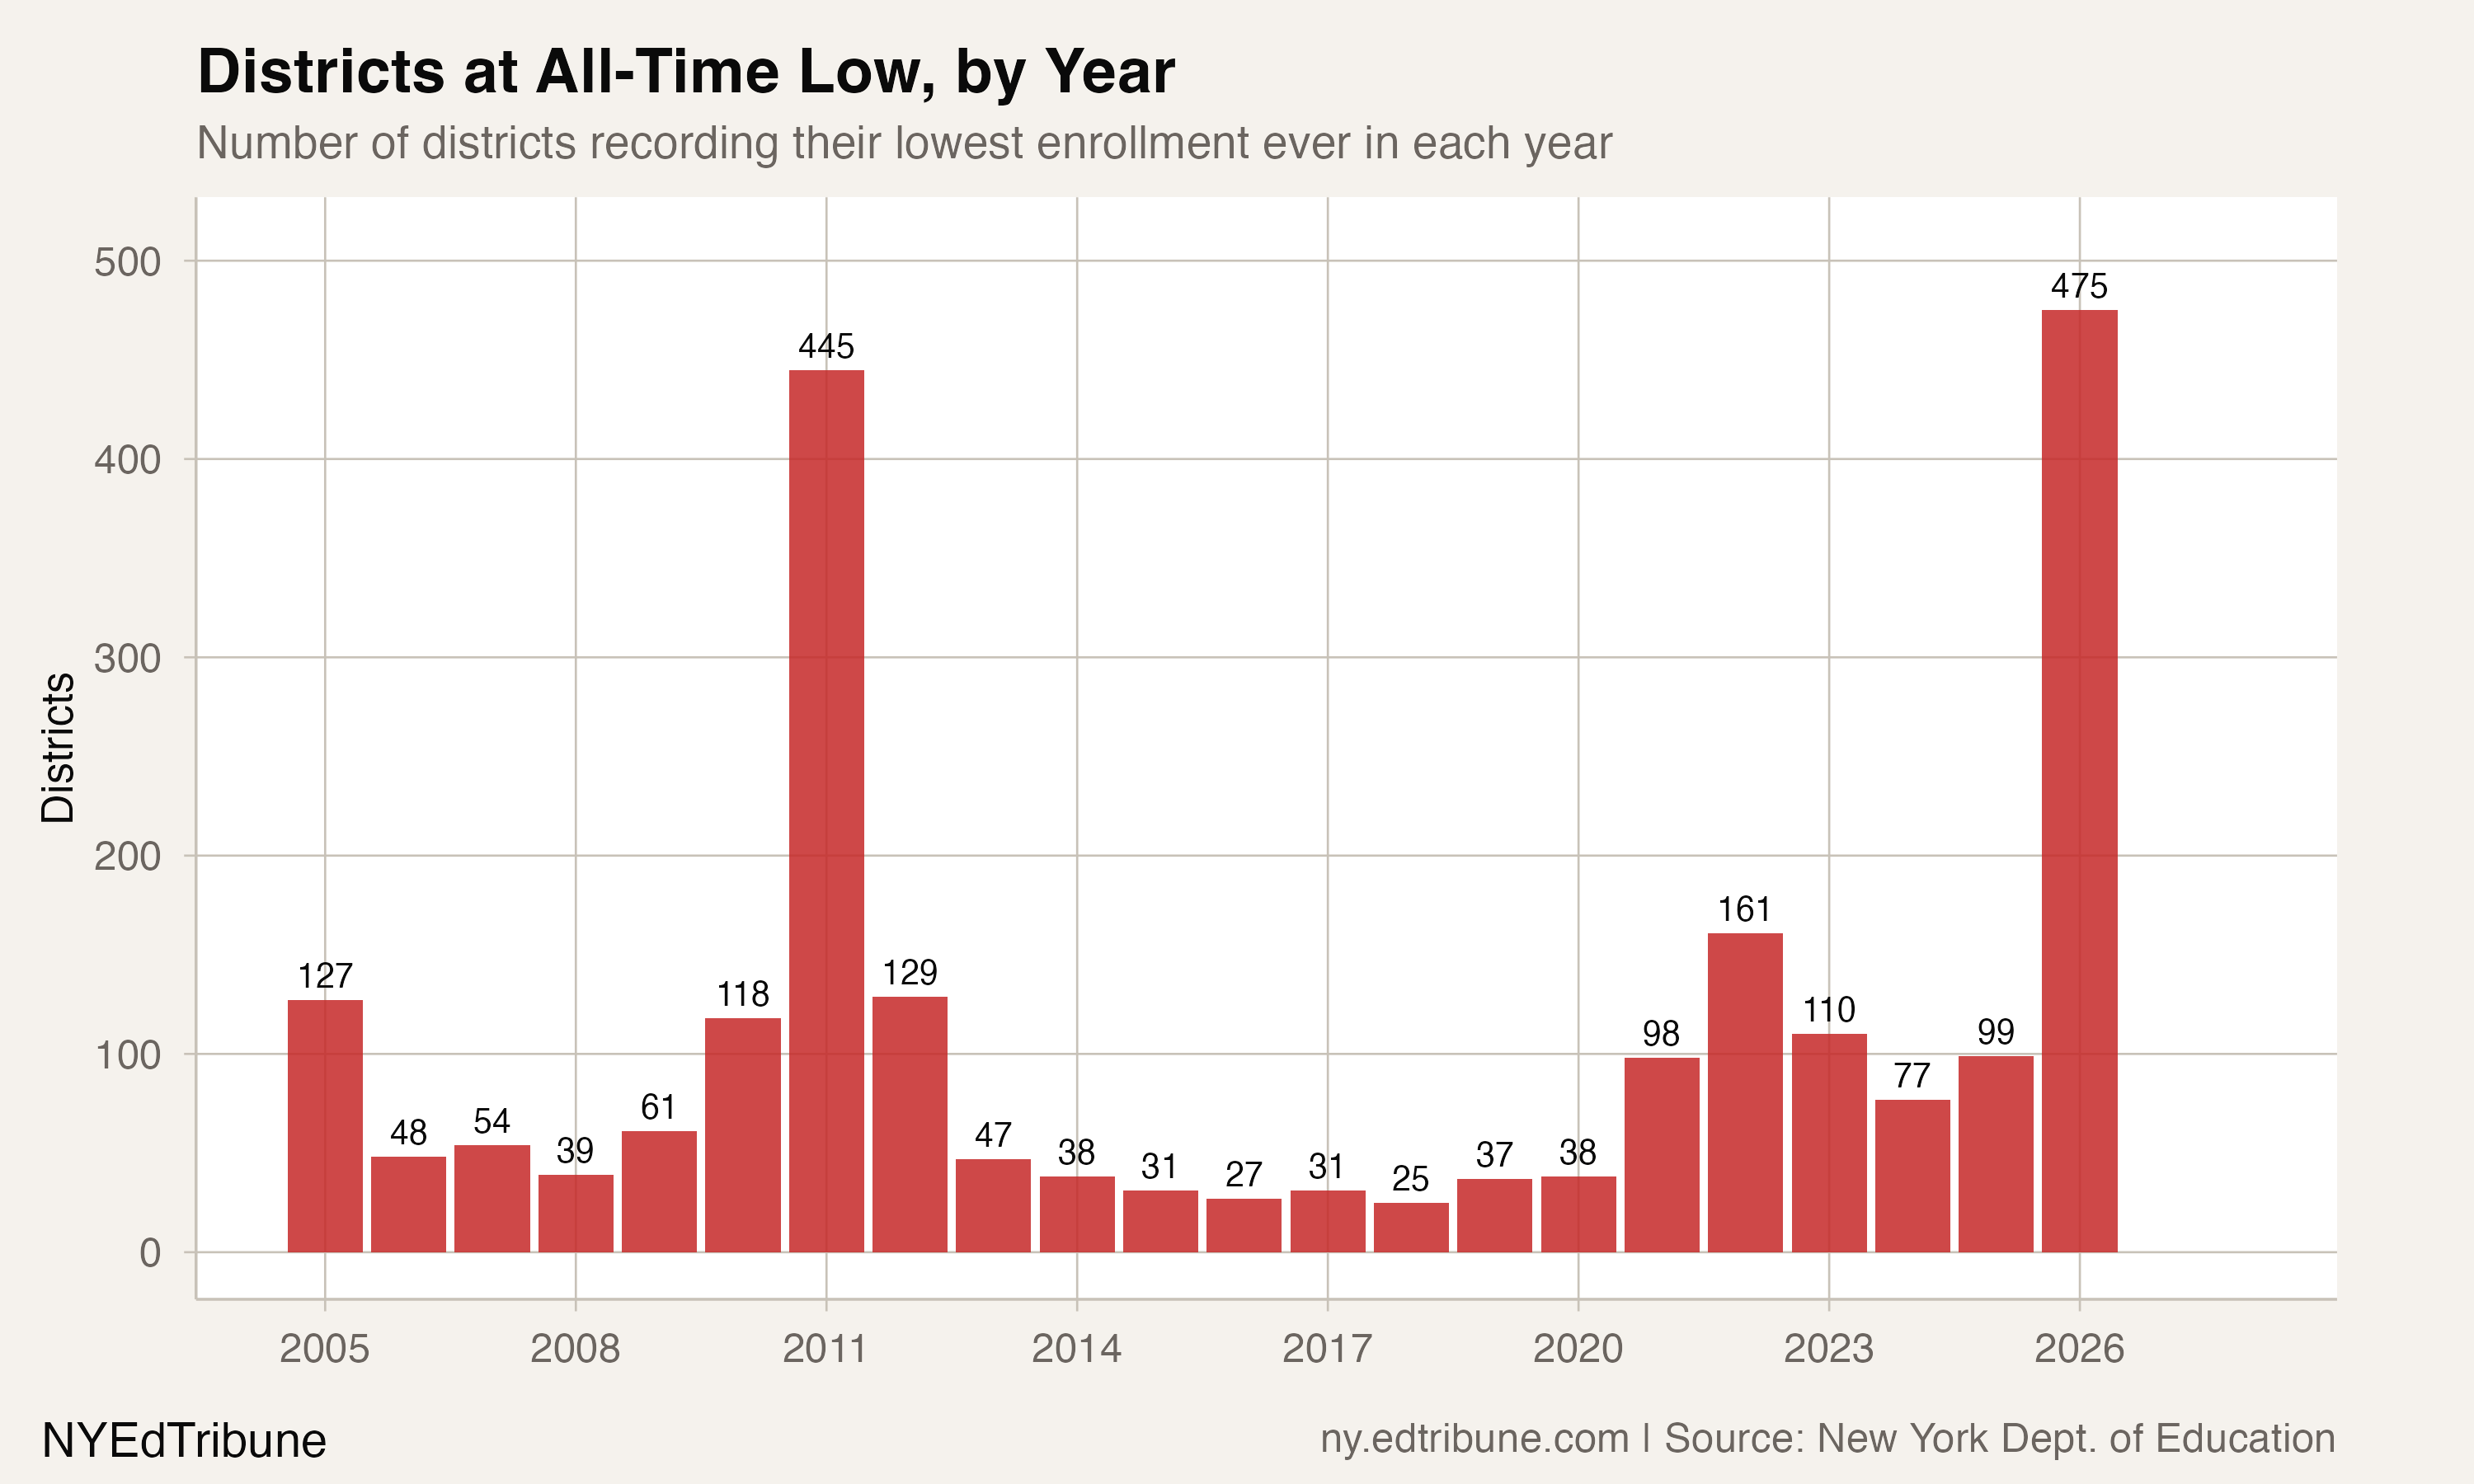
In a typical year, a few dozen New York school districts touch their lowest enrollment on record. In 2026, 475 did.
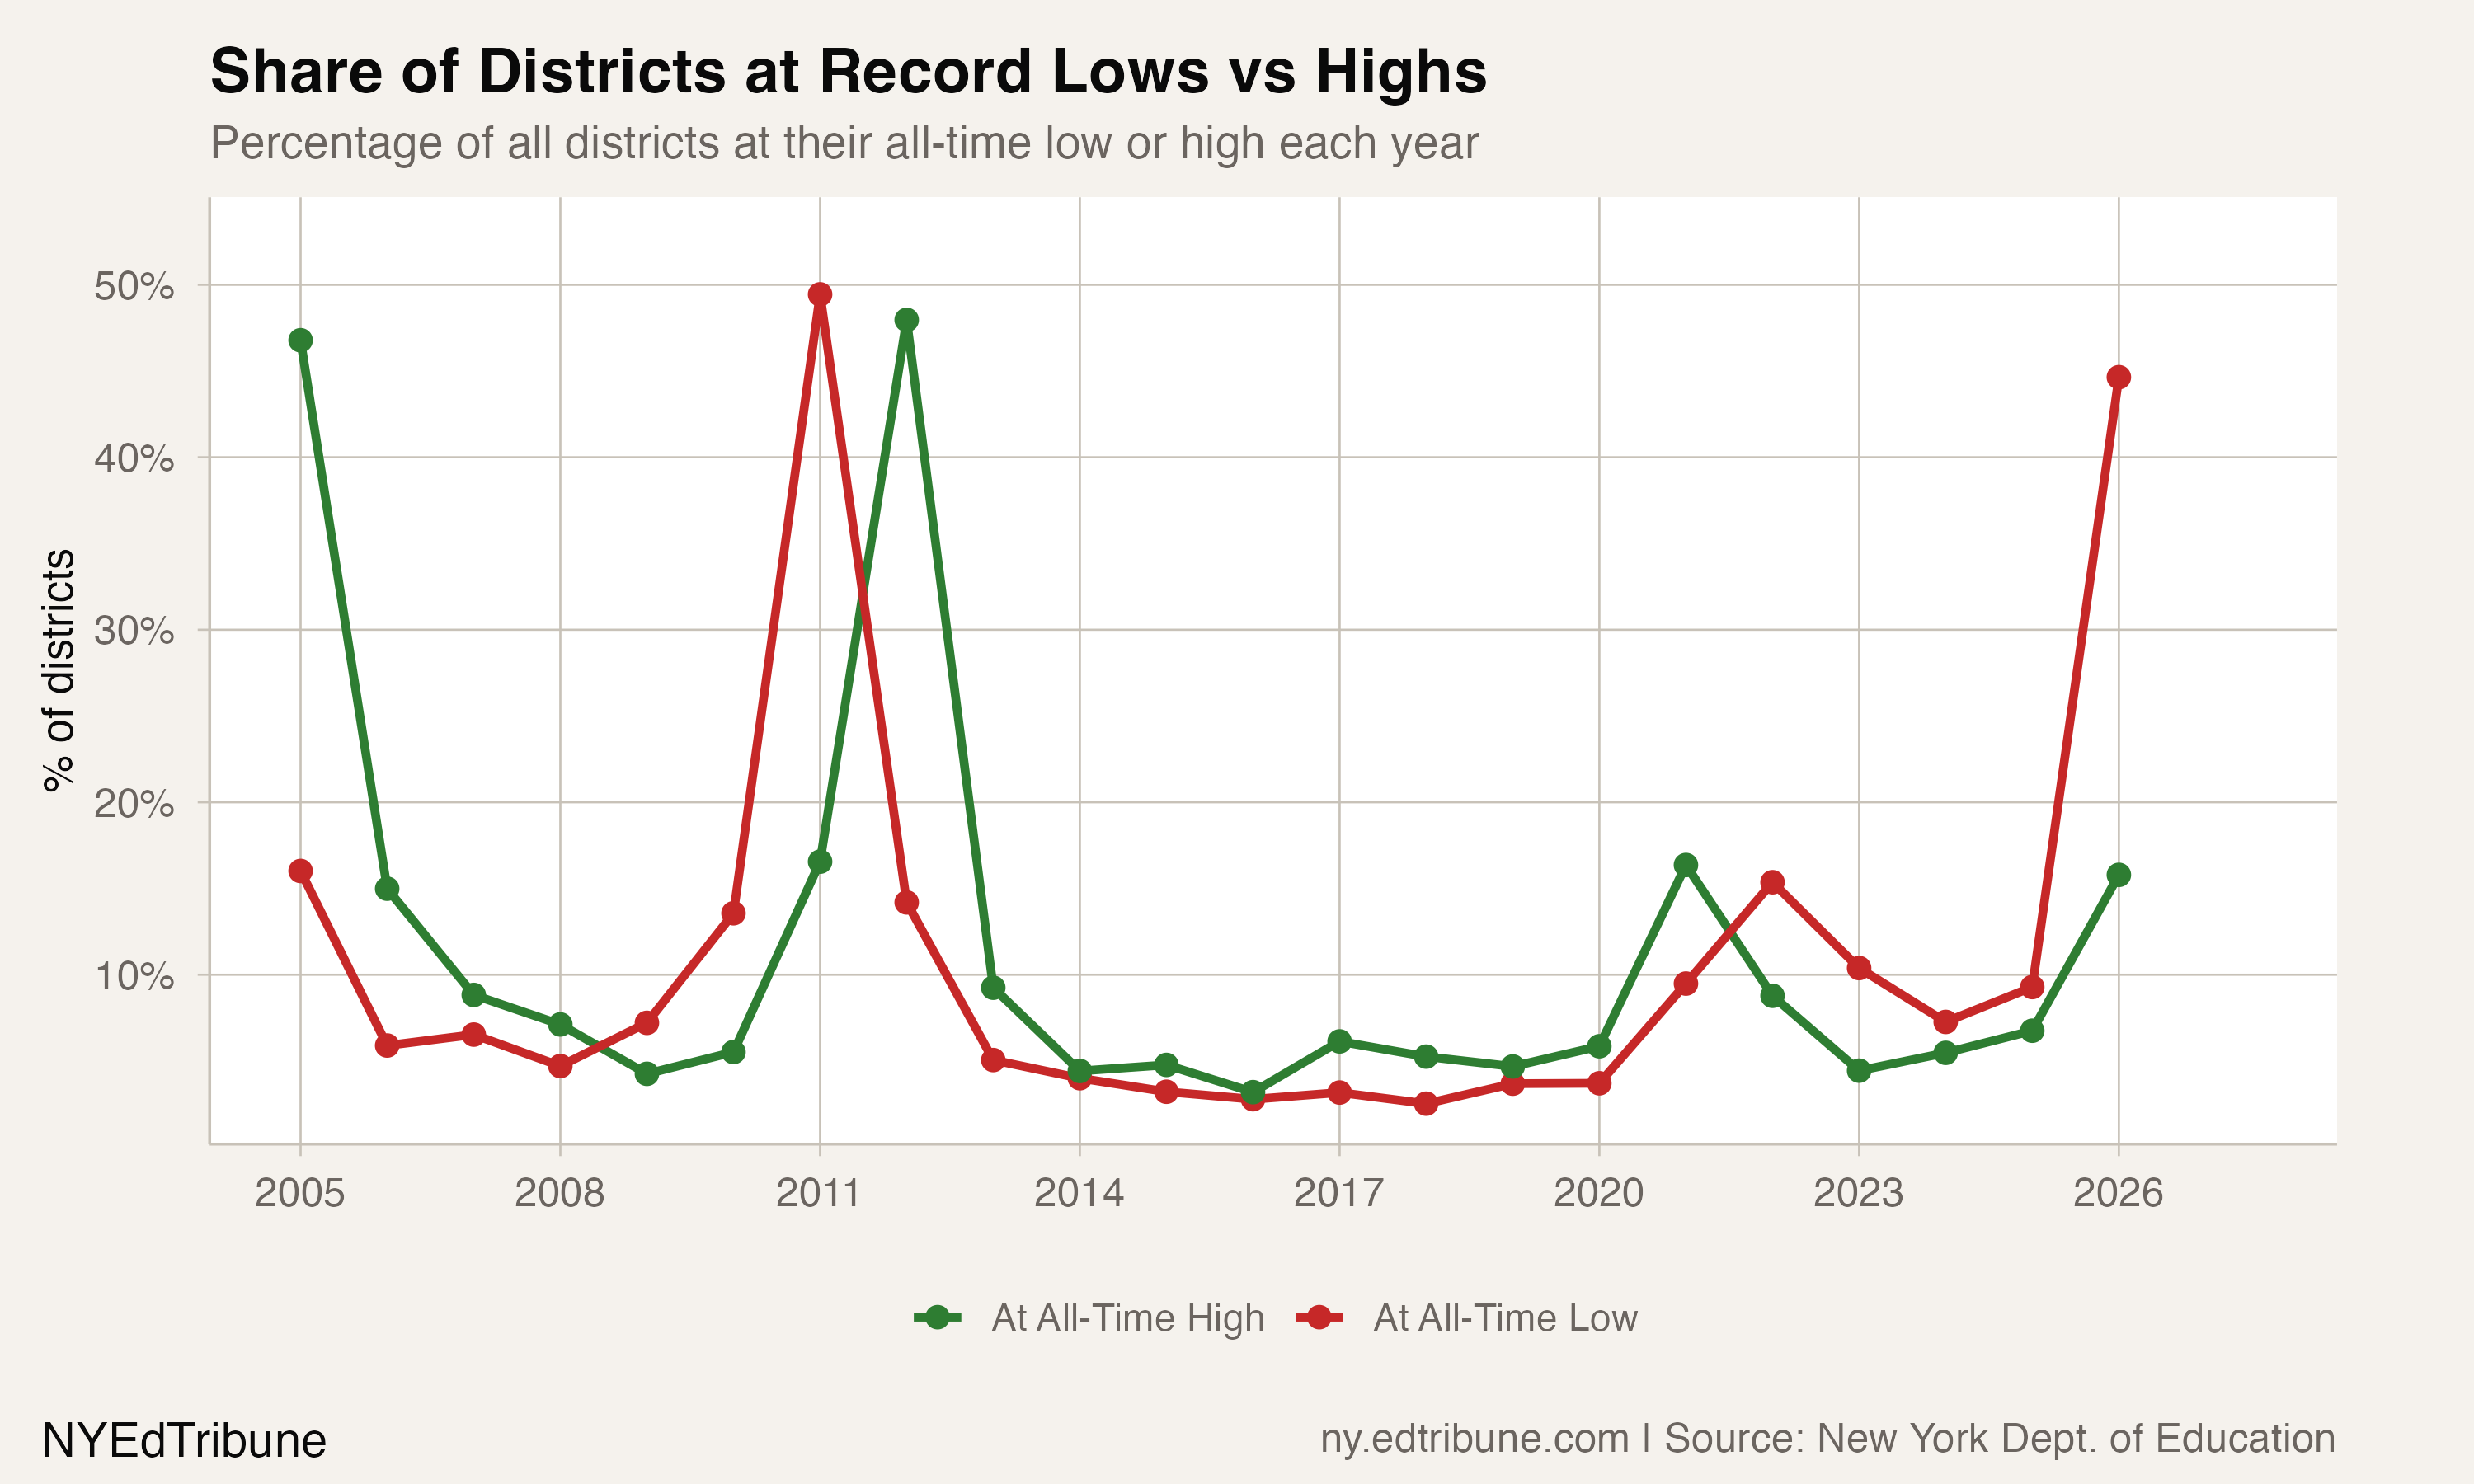
That is 44.6% of the state's 1,064 districts, and the highest count in at least 22 years of data. The previous peak was 2011, when 445 districts bottomed out. In most years since then, the number has hovered between 25 and 100. The 2026 figure is not an incremental worsening. It is a structural break, a year in which nearly half the state's school systems simultaneously crossed into territory they have never occupied before.
The largest systems are the hardest hit
The districts at all-time lows are not primarily small rural systems losing their last few students. The list is dominated by the state's largest districts, and the pattern is sharply size-dependent: 65.7% of districts enrolling 10,000 or more students are at record lows, compared with 38.9% of districts under 500.
Twenty-four of New York City's 32 geographic districts are at all-time lows. The five largest are NYC Geographic District #31 (Staten Island)↗ET at 56,139, NYC Geographic District #2 (Manhattan)↗ET at 52,935, NYC Geographic District #24 (Queens)↗ET at 45,516, NYC Geographic District #20 (Brooklyn)↗ET at 43,051, and NYC Geographic District #10 (Bronx)↗ET at 39,519. Each serves more students than most American school districts. Each is at its lowest point since at least 2005.

Outside the city, Yonkers↗ET (23,286) and Rochester↗ET (21,216) are also at all-time lows. Rochester has lost 10,146 students since its 2012 peak, a 32.4% decline. Buffalo↗ET (29,695) and Syracuse↗ET (18,794) are not at record lows, though both remain well below their historical peaks.
A statewide contraction
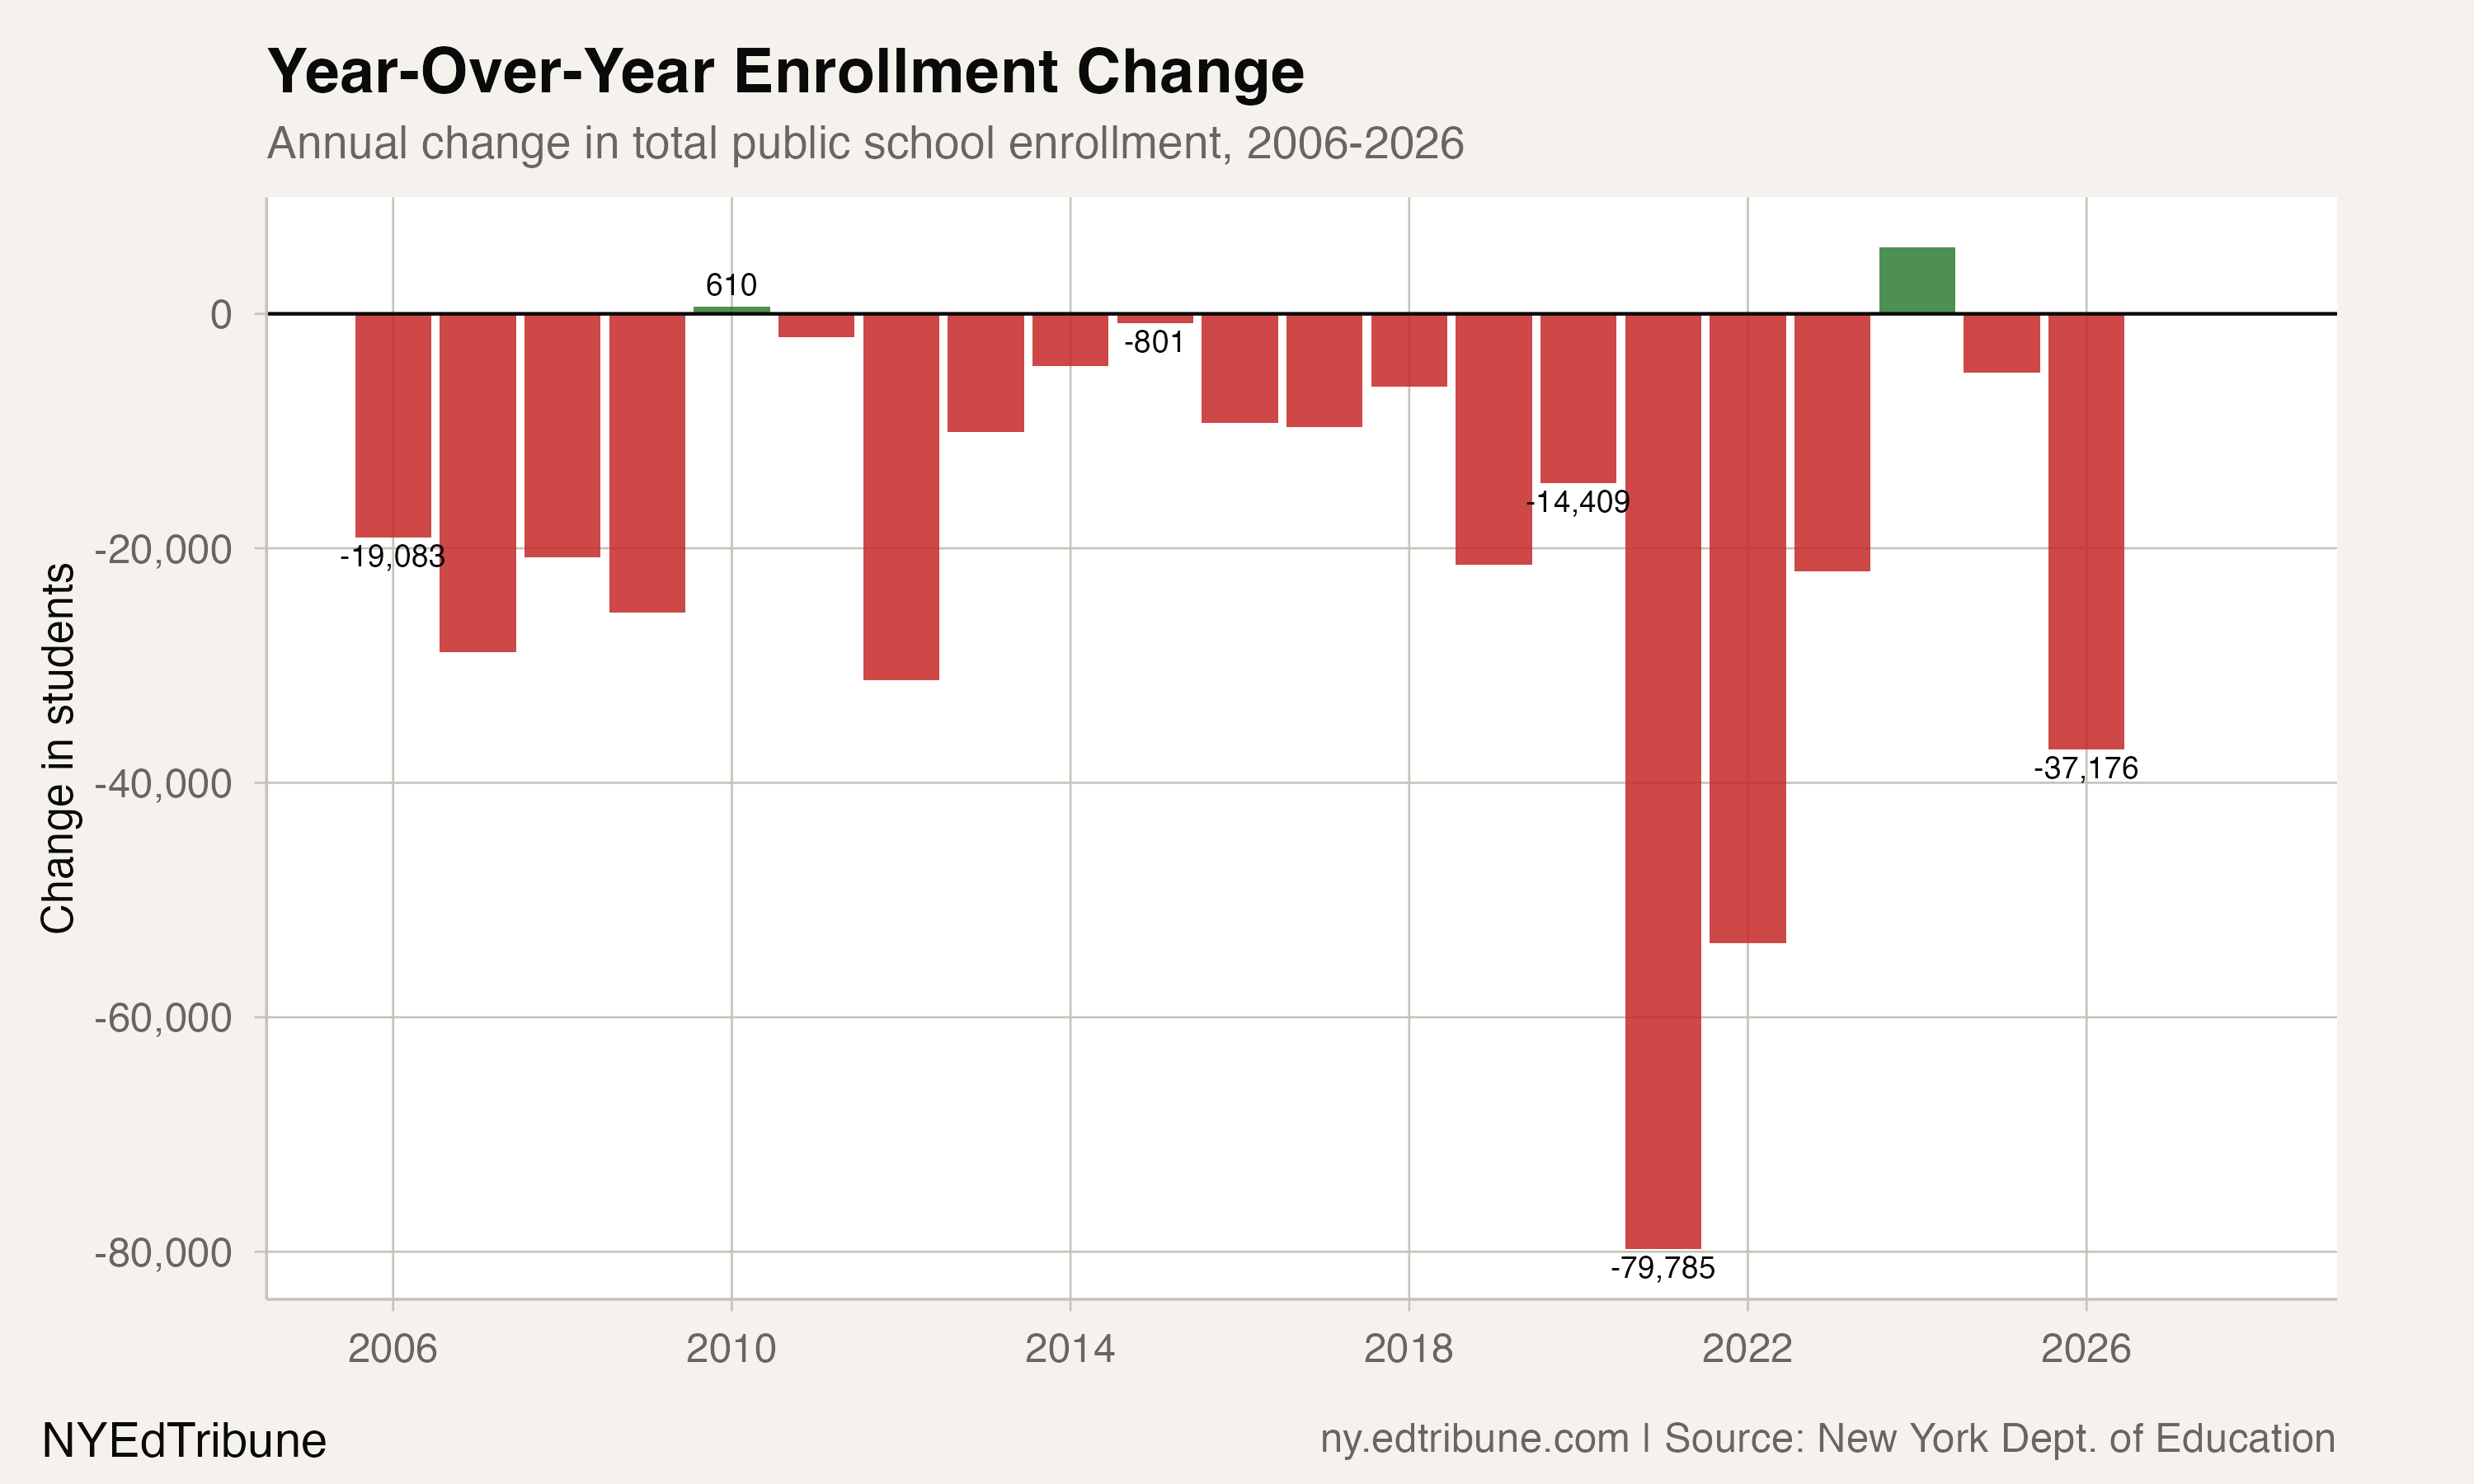
New York enrolled 2,447,074 students in 2026, down from a peak of 2,842,058 in 2005. That is a loss of 394,984 students, or 13.9%, over 21 years. The 2026 year-over-year decline of 37,176 students is the second-largest non-COVID drop in the dataset, trailing only the 53,647-student loss in 2022.
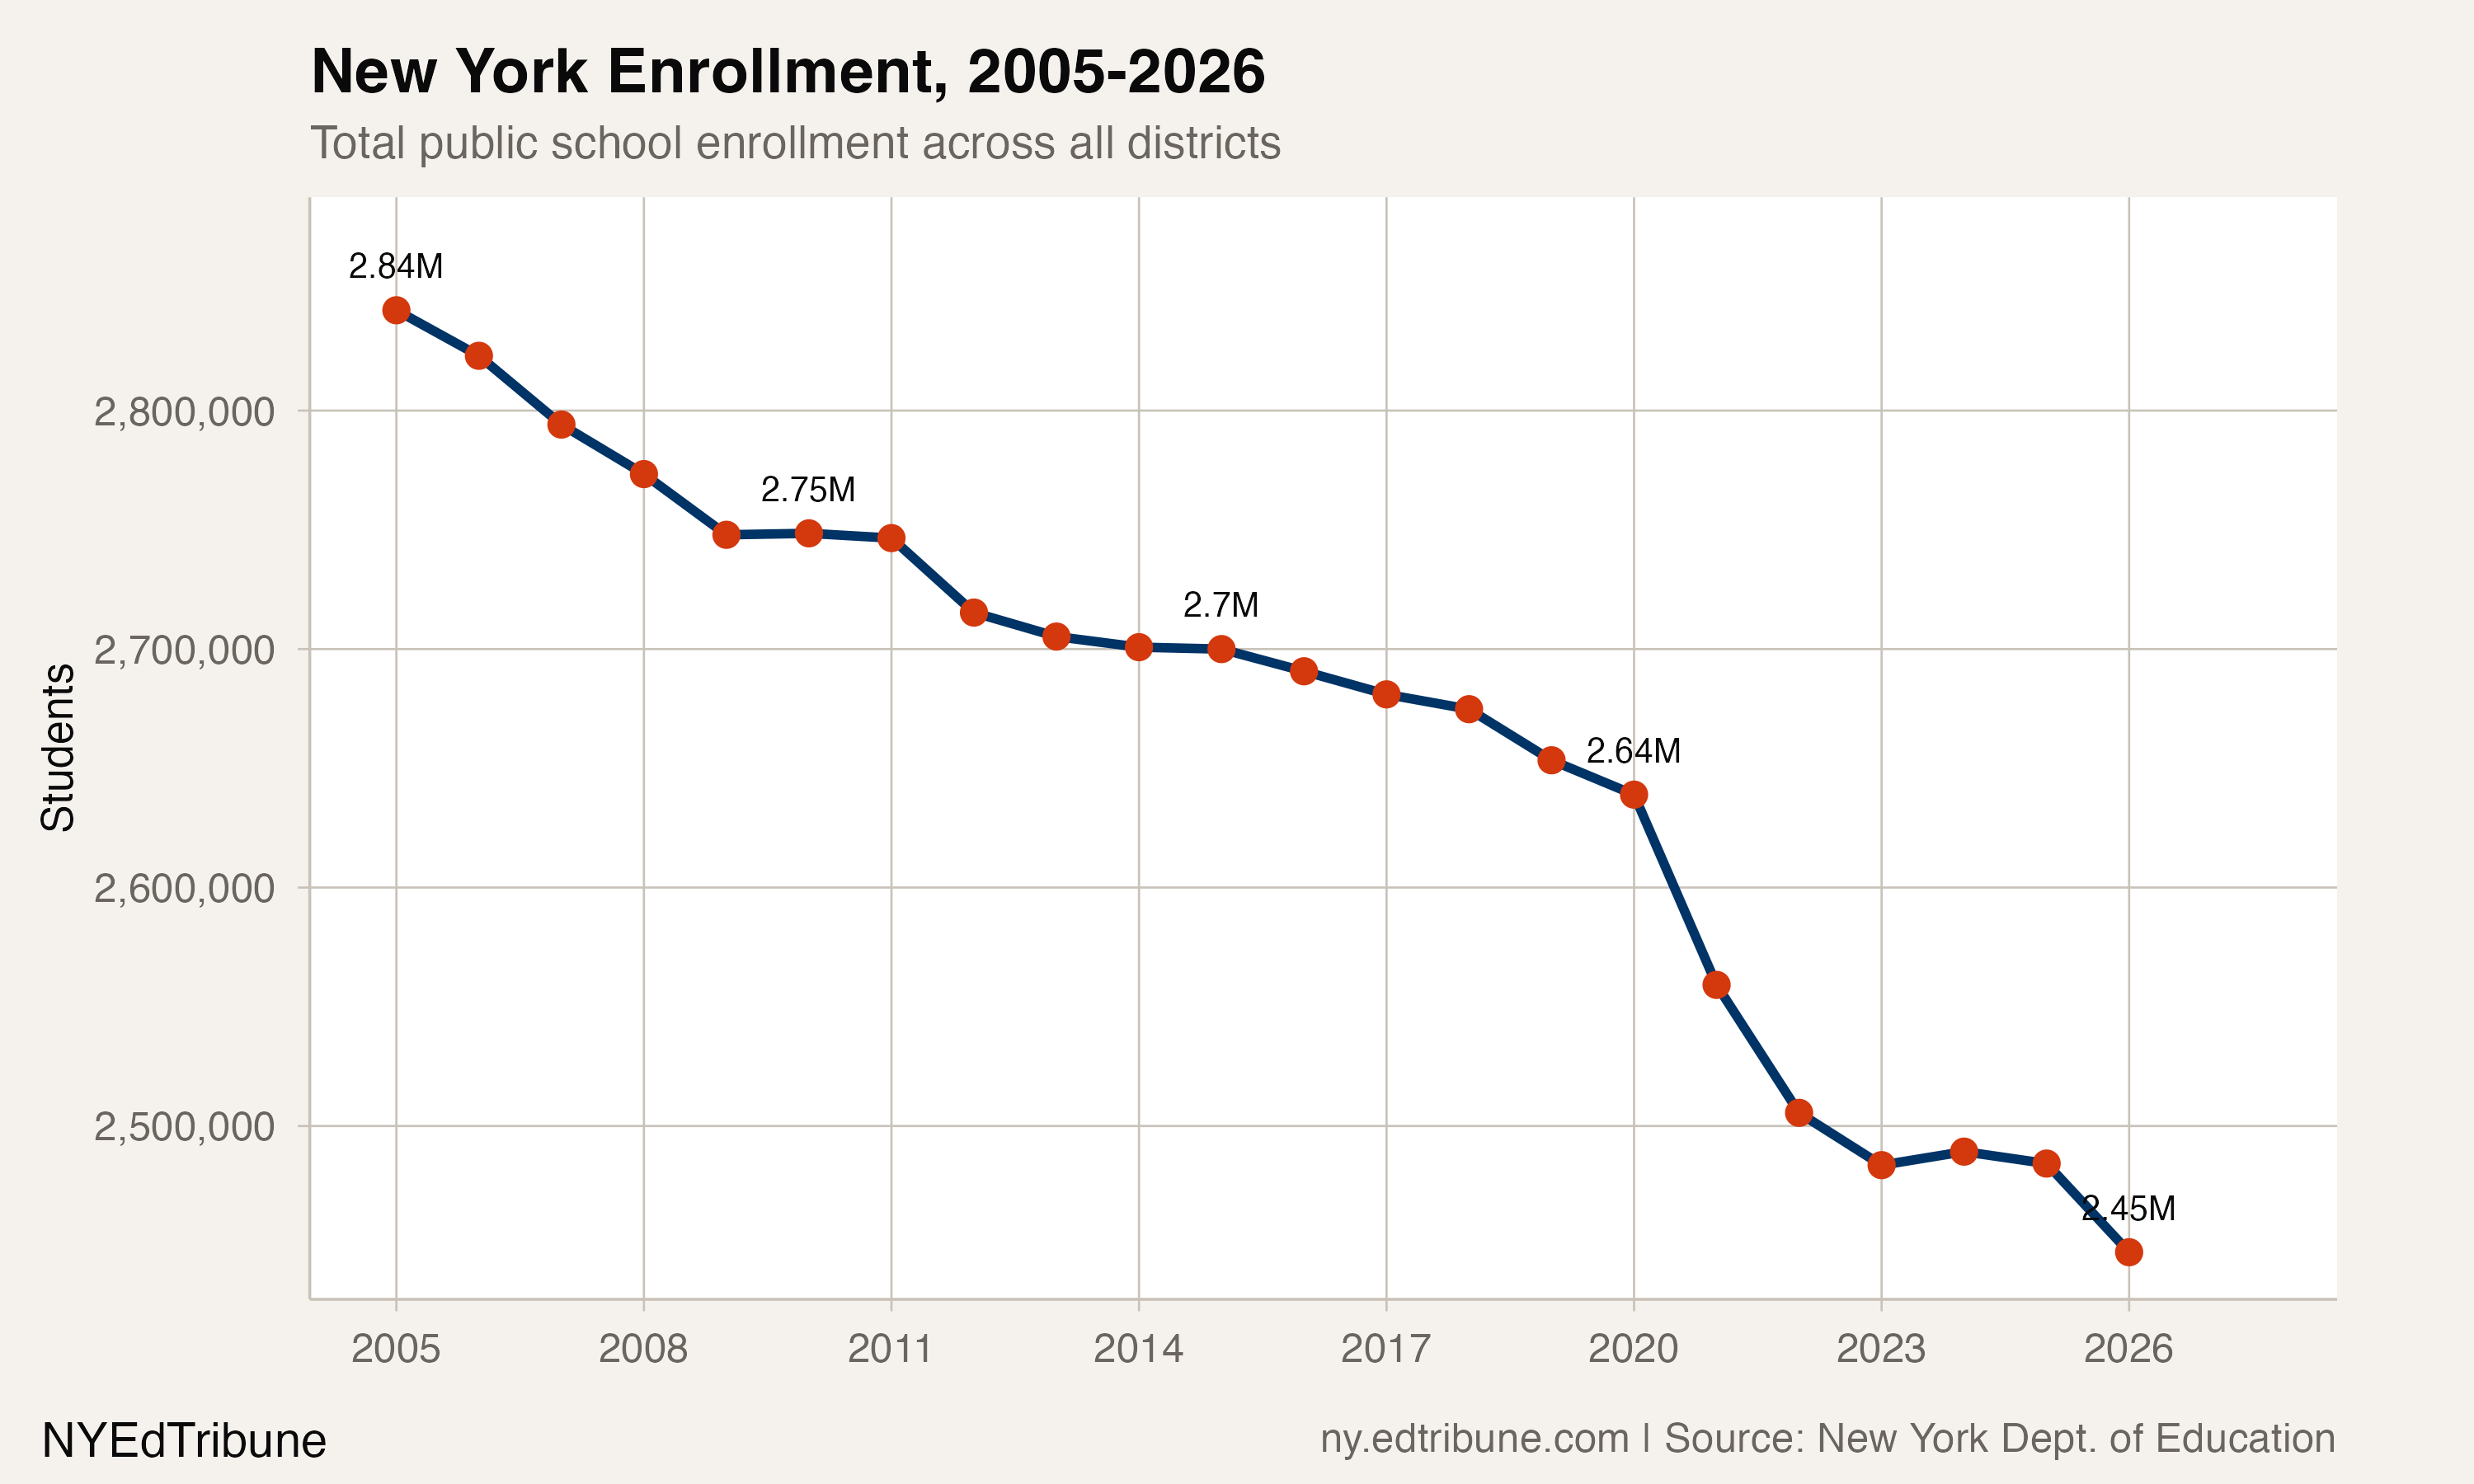
The pace of decline has accelerated since the pandemic. From 2005 to 2019, New York lost an average of roughly 13,500 students per year. From 2019 to 2026, the average annual loss has been 29,469. The state gained a small number of students in only two of the past 22 years: 610 in 2010 and 5,669 in 2024, when a surge of migrant families temporarily reversed the trajectory.
That 2024 reprieve did not hold. The 2026 figure represents a complete erasure of the 2024 gains and then some, with 65.4% of districts declining year over year.
The few that are growing
Against this backdrop, 168 districts are at all-time highs. The composition of that list is telling.
The largest entity at an all-time high is NYC Special Schools (District 75), which serves students with significant disabilities across the city and enrolled 29,975 students. After that, the list drops sharply in size: Rush Henrietta↗ET (5,646), Penfield↗ET (4,706), and Harrison (3,806) are among the few traditional districts at record highs. The median enrollment of a district at its all-time high is 596 students, compared with 964 for districts at all-time lows. Many of the districts at highs are charter schools that opened within the past decade and are still growing into their intended grade spans.
Birth rates, housing costs, and the departure pipeline
The most direct driver of sustained enrollment decline is demographic. New York's fertility rate fell from 61.2 births per 1,000 women in 2008 to 54.1 in 2020, a 12% decline over 12 years. The rate dropped most steeply among women under 30, and the trend predates the pandemic.
A Cornell University study published in December 2025 placed the decline in a broader frame:
"An aging population is the big driver of this pattern of K-12 enrollment decline, including people having fewer children and at later ages." — Leslie Reynolds, Cornell University, December 2025
Housing costs compound the birth rate effect. The proportion of income that residents in their 20s and 30s pay for rent or mortgages has risen substantially, and the average age of first-time homebuyers in New York has shifted from roughly 29 to the early 40s, according to the New York State School Boards Association. Families who cannot afford housing in New York are starting families elsewhere.
The 2024 enrollment bump, driven by migrant families entering New York City schools, proved temporary. Federal enforcement actions and the closure of dozens of migrant shelters starting in early 2025 reversed the inflow, and the city's K-12 enrollment fell 2.4% in a single year.
A funding formula that cannot see the floor
New York's Foundation Aid formula includes a "save harmless" provision that prevents any district's state allocation from falling year over year, regardless of enrollment changes. In the 2025 fiscal year, half of all districts (334 of 670) would have seen a Foundation Aid decrease without this protection.
The provision insulates shrinking districts from immediate budget crises but creates a growing fiscal mismatch. As New York Focus reported in May 2025:
"The bulk of state support for school districts stays flat even when enrollment declines." — New York Focus, May 2025
In New York City, the arithmetic is starker. After enrollment dropped by 22,000 students, city officials announced they would hold schools harmless from $250 million in midyear budget cuts. New York City alone has spent $1.6 billion over six years protecting schools from enrollment-related cuts, with $388 million allocated in 2025-26 alone. Ana Champeny of the Citizens Budget Commission warned that "the shock to some school budgets would be pretty severe" if the funding were removed abruptly. Meanwhile, 22 school districts statewide were in a state of "fiscal stress" in the most recent comptroller's report, up from 16 the prior year.
What comes next
The 475-district figure in 2026 breaks a pattern. For most of the past decade, all-time-low counts stayed below 100 because many districts had already bottomed out in earlier years and partially recovered, or because the decline was gradual enough that only a handful of new districts crossed the threshold each year. The 2026 surge suggests that a large cohort of districts that had been declining slowly for years all crossed their previous floors simultaneously, pushed past their old lows by the combined weight of falling births, post-pandemic exits, and an immigration reprieve that lasted exactly one year.
For a district at its lowest enrollment since 2005, every year forward is uncharted territory for staffing, facilities planning, and revenue. The kindergarten cohorts entering the system were born into New York's lowest fertility years. No year in the near future will reverse that.
Detailed code that reproduces the analysis and figures in this article is available exclusively to EdTribune subscribers.
Discussion
Sign in to join the discussion.
Loading comments...