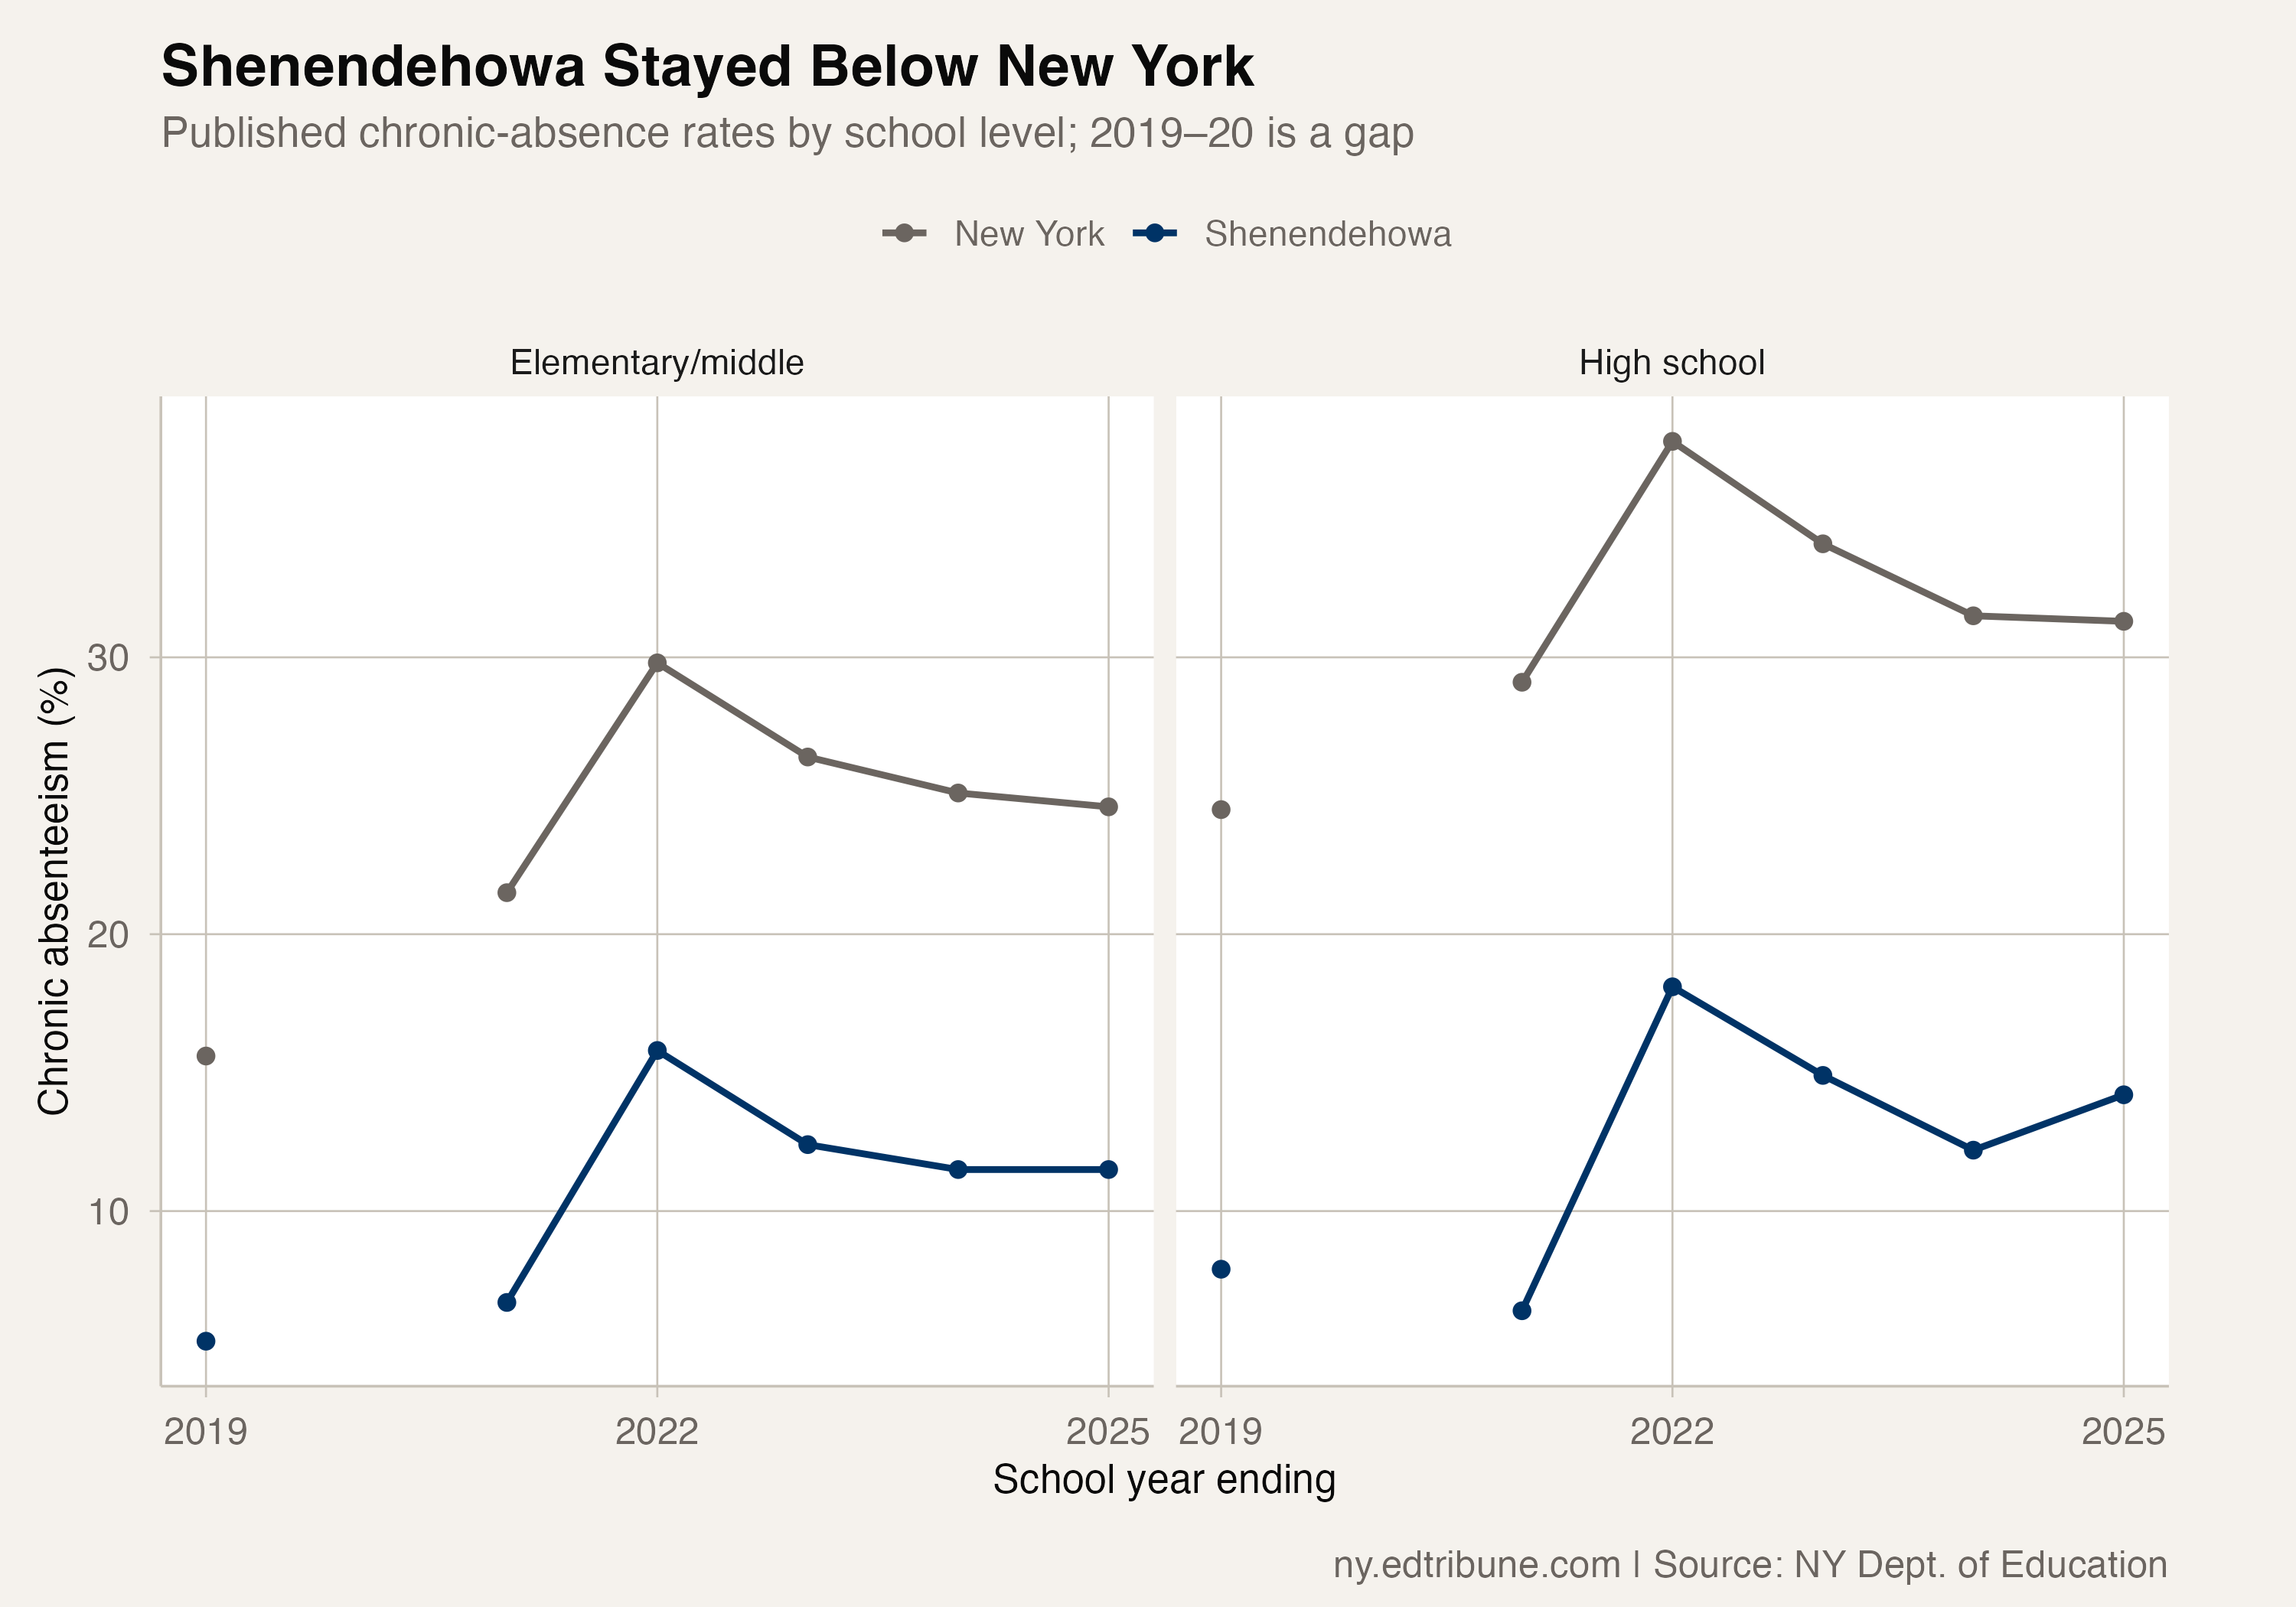
Shenendehowa Central School District↗ET remained below New York’s chronic-absence rates in 2024-25. Its elementary and middle school rate was 11.5%, compared with 24.6% statewide. Its high-school rate was 14.2%, compared with 31.3% statewide.
Those comparisons tell a more qualified story than a single district average. Shenendehowa’s elementary and middle school rate was unchanged from the year before. Its high-school rate rose from 12.2% to 14.2%, a two-point increase. Being below the state does not mean attendance kept improving.
New York’s parent dashboard explains chronic absenteeism as missing at least a tenth of enrolled school days. The state reports elementary/middle and high-school results separately. Each comparison here uses the published rate for the same school level and year, rather than combining different student populations into an average.
Below the state through the disruption
Shenendehowa was below the statewide rate in both school levels in all six published years: 2018-19 and 2020-21 through 2024-25. The missing 2019-20 observation remains a gap in the charts.
Before the pandemic, in 2018-19, the district’s elementary/middle rate was 5.3% and its high-school rate was 7.9%. The corresponding state rates were 15.6% and 24.5%.
Both district rates reached their highest values in the available record in 2021-22: 15.8% for elementary/middle and 18.1% for high school. The subsequent improvement was substantial, but the latest results were still above those pre-pandemic baselines. The elementary/middle rate was 6.2 points higher than in 2018-19; high school was 6.3 points higher.
A district can therefore be ahead of the statewide comparison while still missing its own earlier attendance level. Shenendehowa meets both descriptions. The state comparison establishes a difference in outcomes; it does not identify an attendance practice that another district could copy.
The high-school reversal
After the 2021-22 high, Shenendehowa’s high-school rate fell to 14.9% in 2022-23 and 12.2% in 2023-24. The rise to 14.2% in 2024-25 interrupts that decline. Over the same latest year, New York’s high-school rate edged down from 31.5% to 31.3%.
That left Shenendehowa 17.1 points below the state high-school rate, compared with a 19.3-point gap the year before. Its relative advantage narrowed even though it remained large.
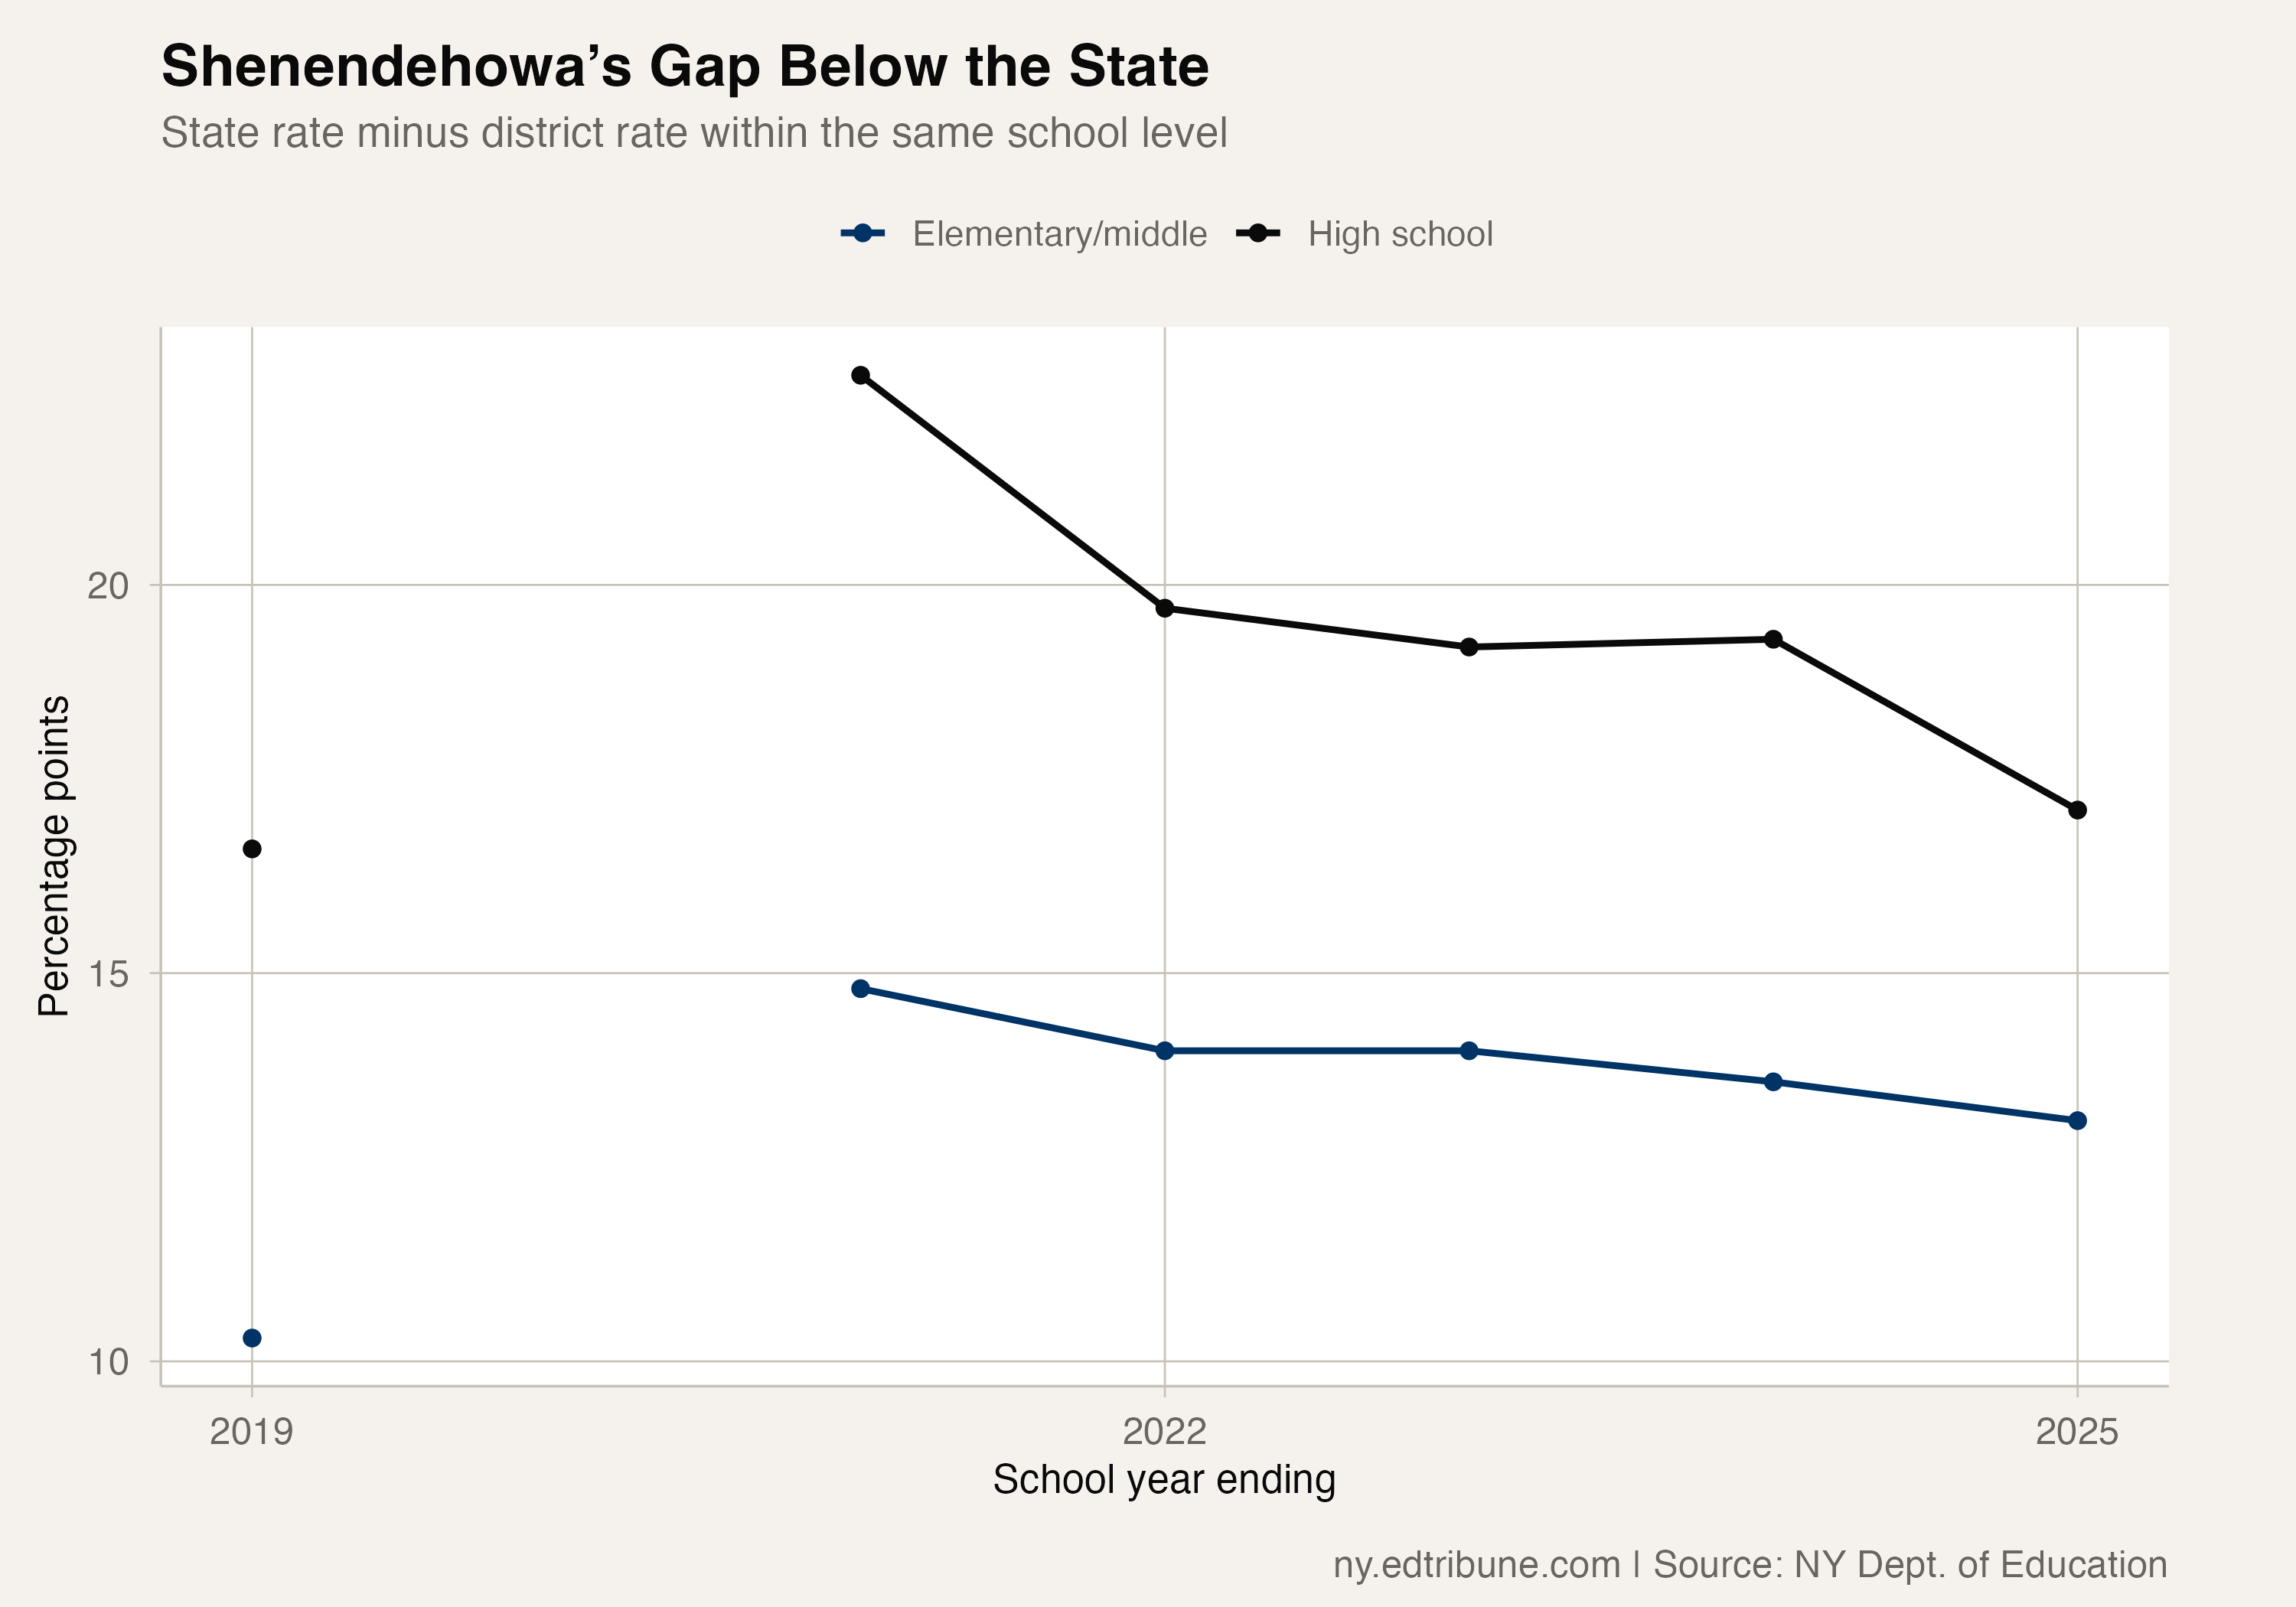
The elementary/middle picture was different. The district stayed at 11.5% while New York’s rate fell from 25.1% to 24.6%. Shenendehowa’s gap below the state narrowed from 13.6 to 13.1 points because the statewide comparison improved.
Differences within the district
The latest school-level figures also vary. Across the 12 schools with published total rates in 2024-25, chronic absenteeism ranged from 4.4% to 18.9%. These are school results, distinct from the district’s two published school-level aggregates.
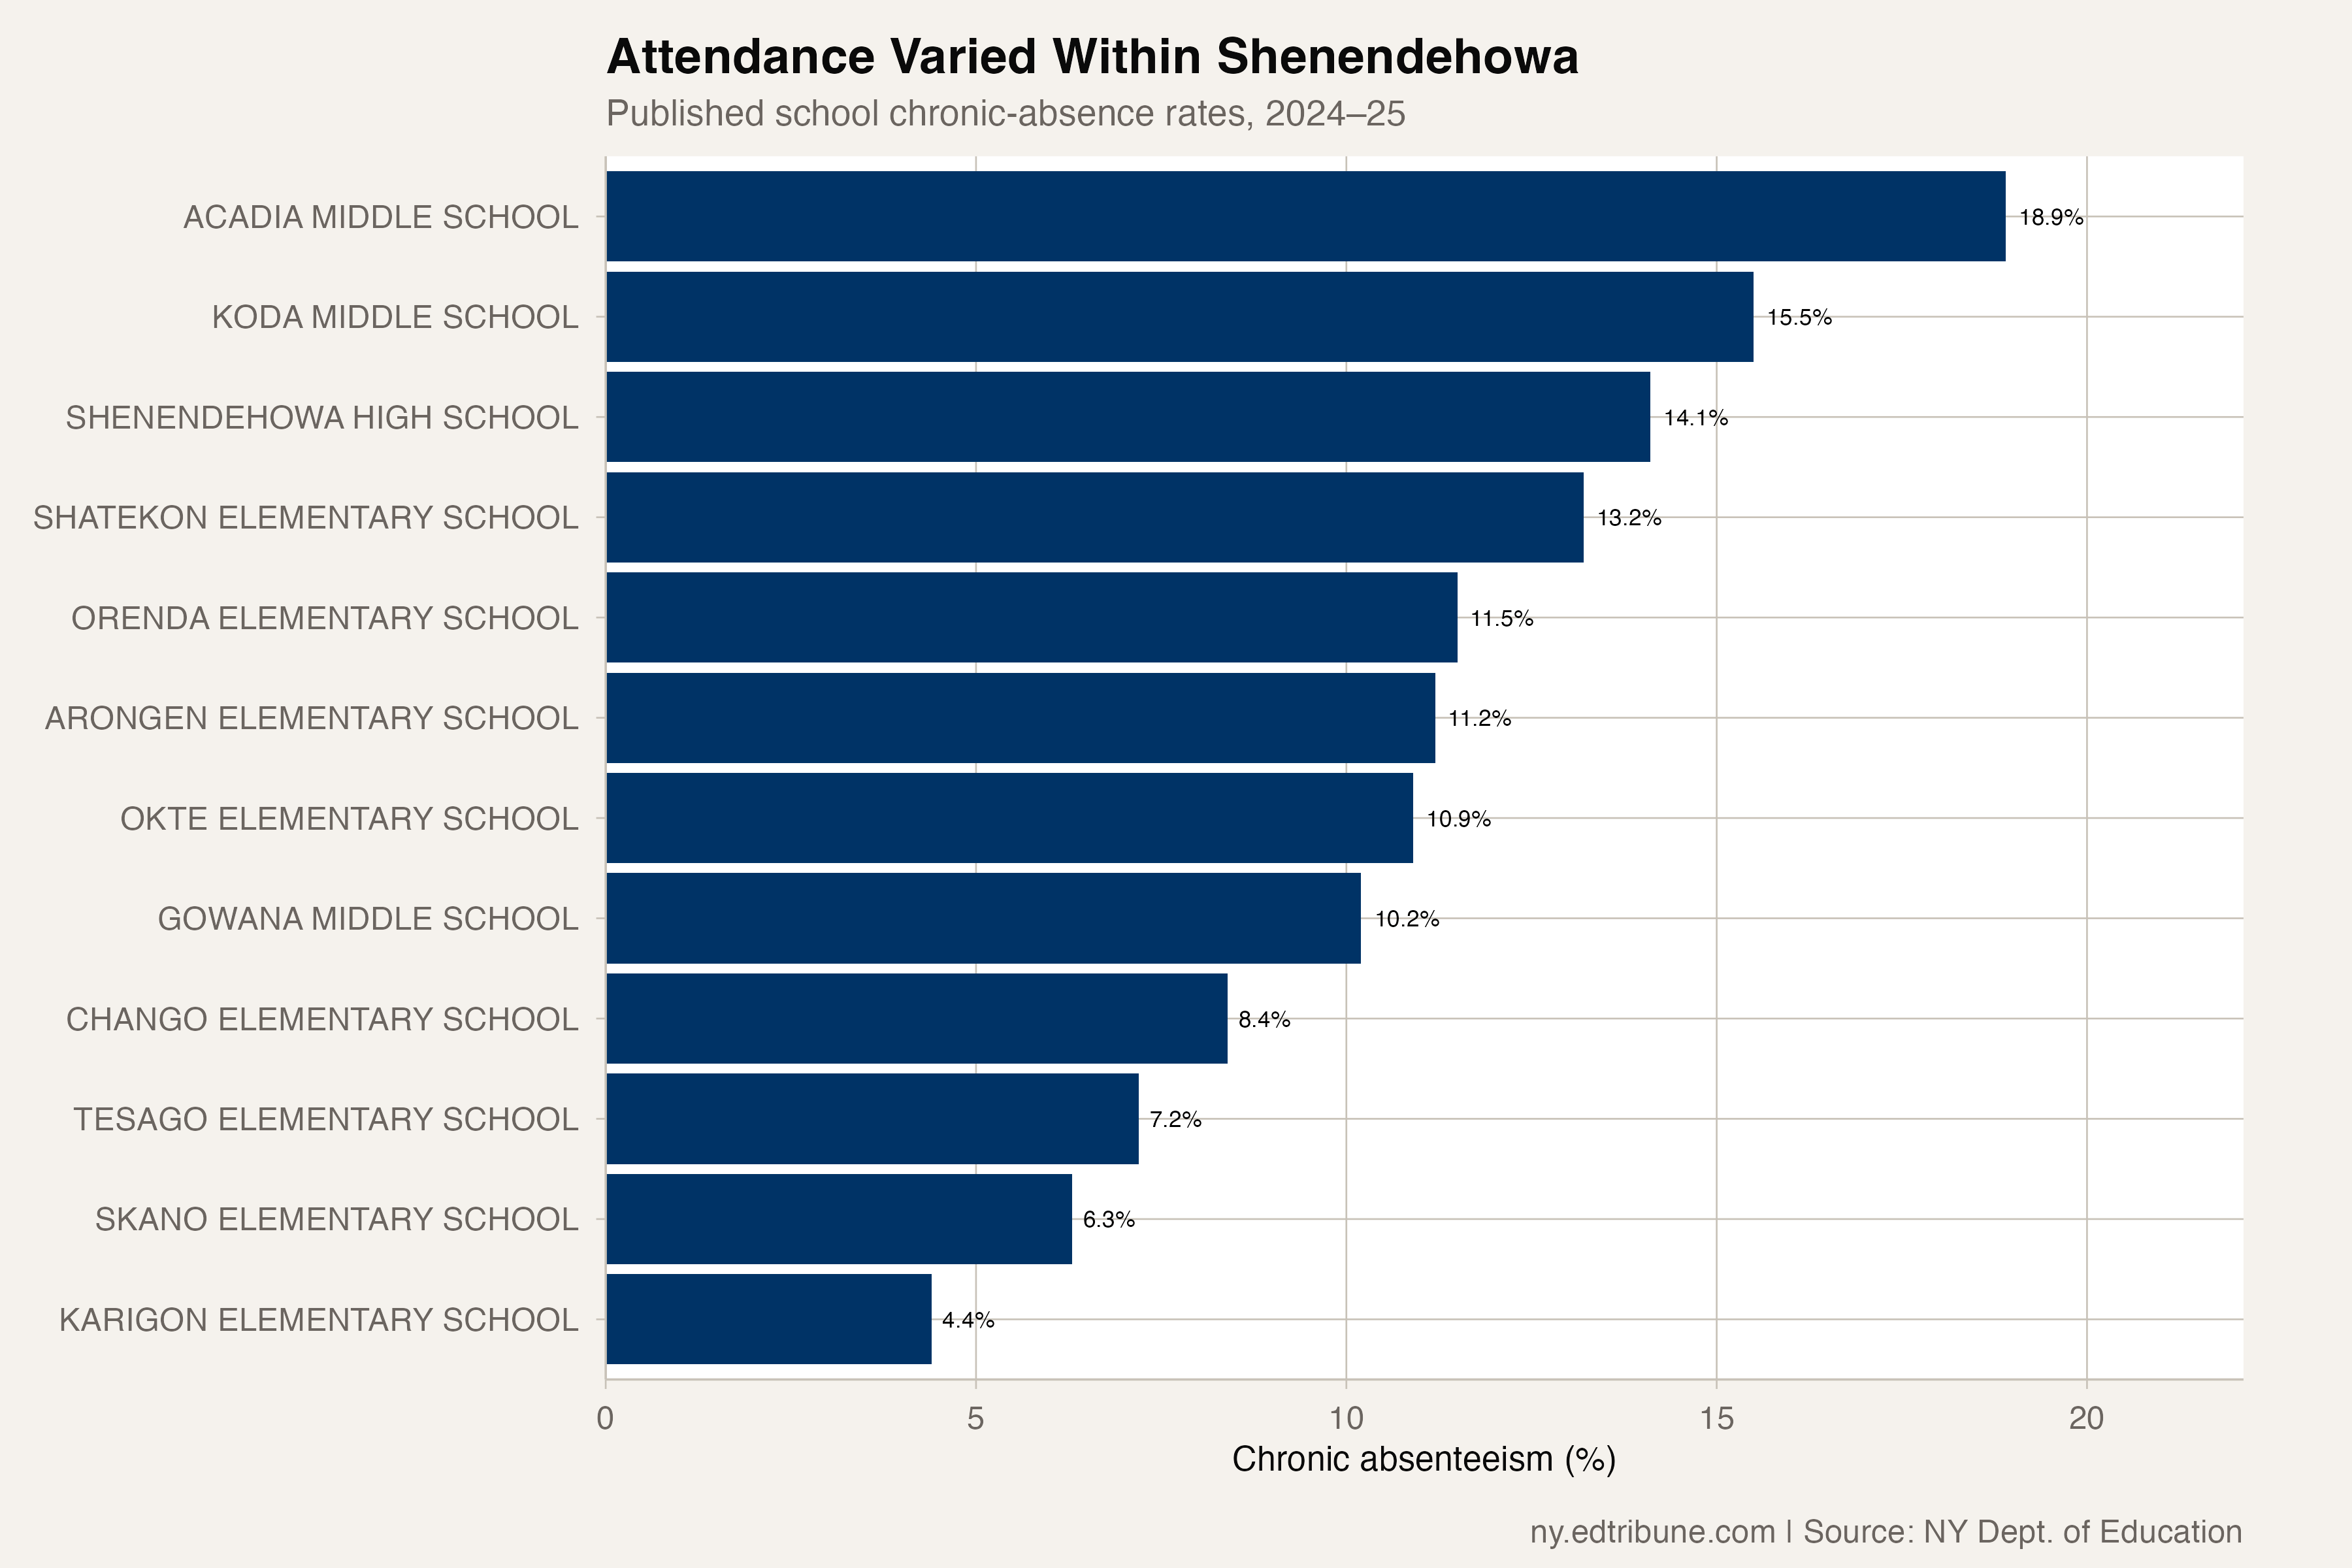
The range cannot establish why attendance differs between buildings. The files do not measure the effects of family communication, transportation, health needs or school programs. Nor do these annual rates follow the same children over time: the enrolled population can change from one reporting year to the next.
For Shenendehowa, the immediate distinction is within its own trajectory. Elementary and middle school attendance held at the previous year’s rate; the high-school measure moved away from its pre-pandemic level. The statewide comparison remains favorable, while that latest high-school reversal deserves attention on its own terms.
Attendance figures come from the New York State Education Department. The most recent published results cover 2024-25; they are not live 2026-27 counts.
Detailed code that reproduces the analysis and figures in this article is available exclusively to EdTribune subscribers.
Discussion
Sign in to join the discussion.
Loading comments...