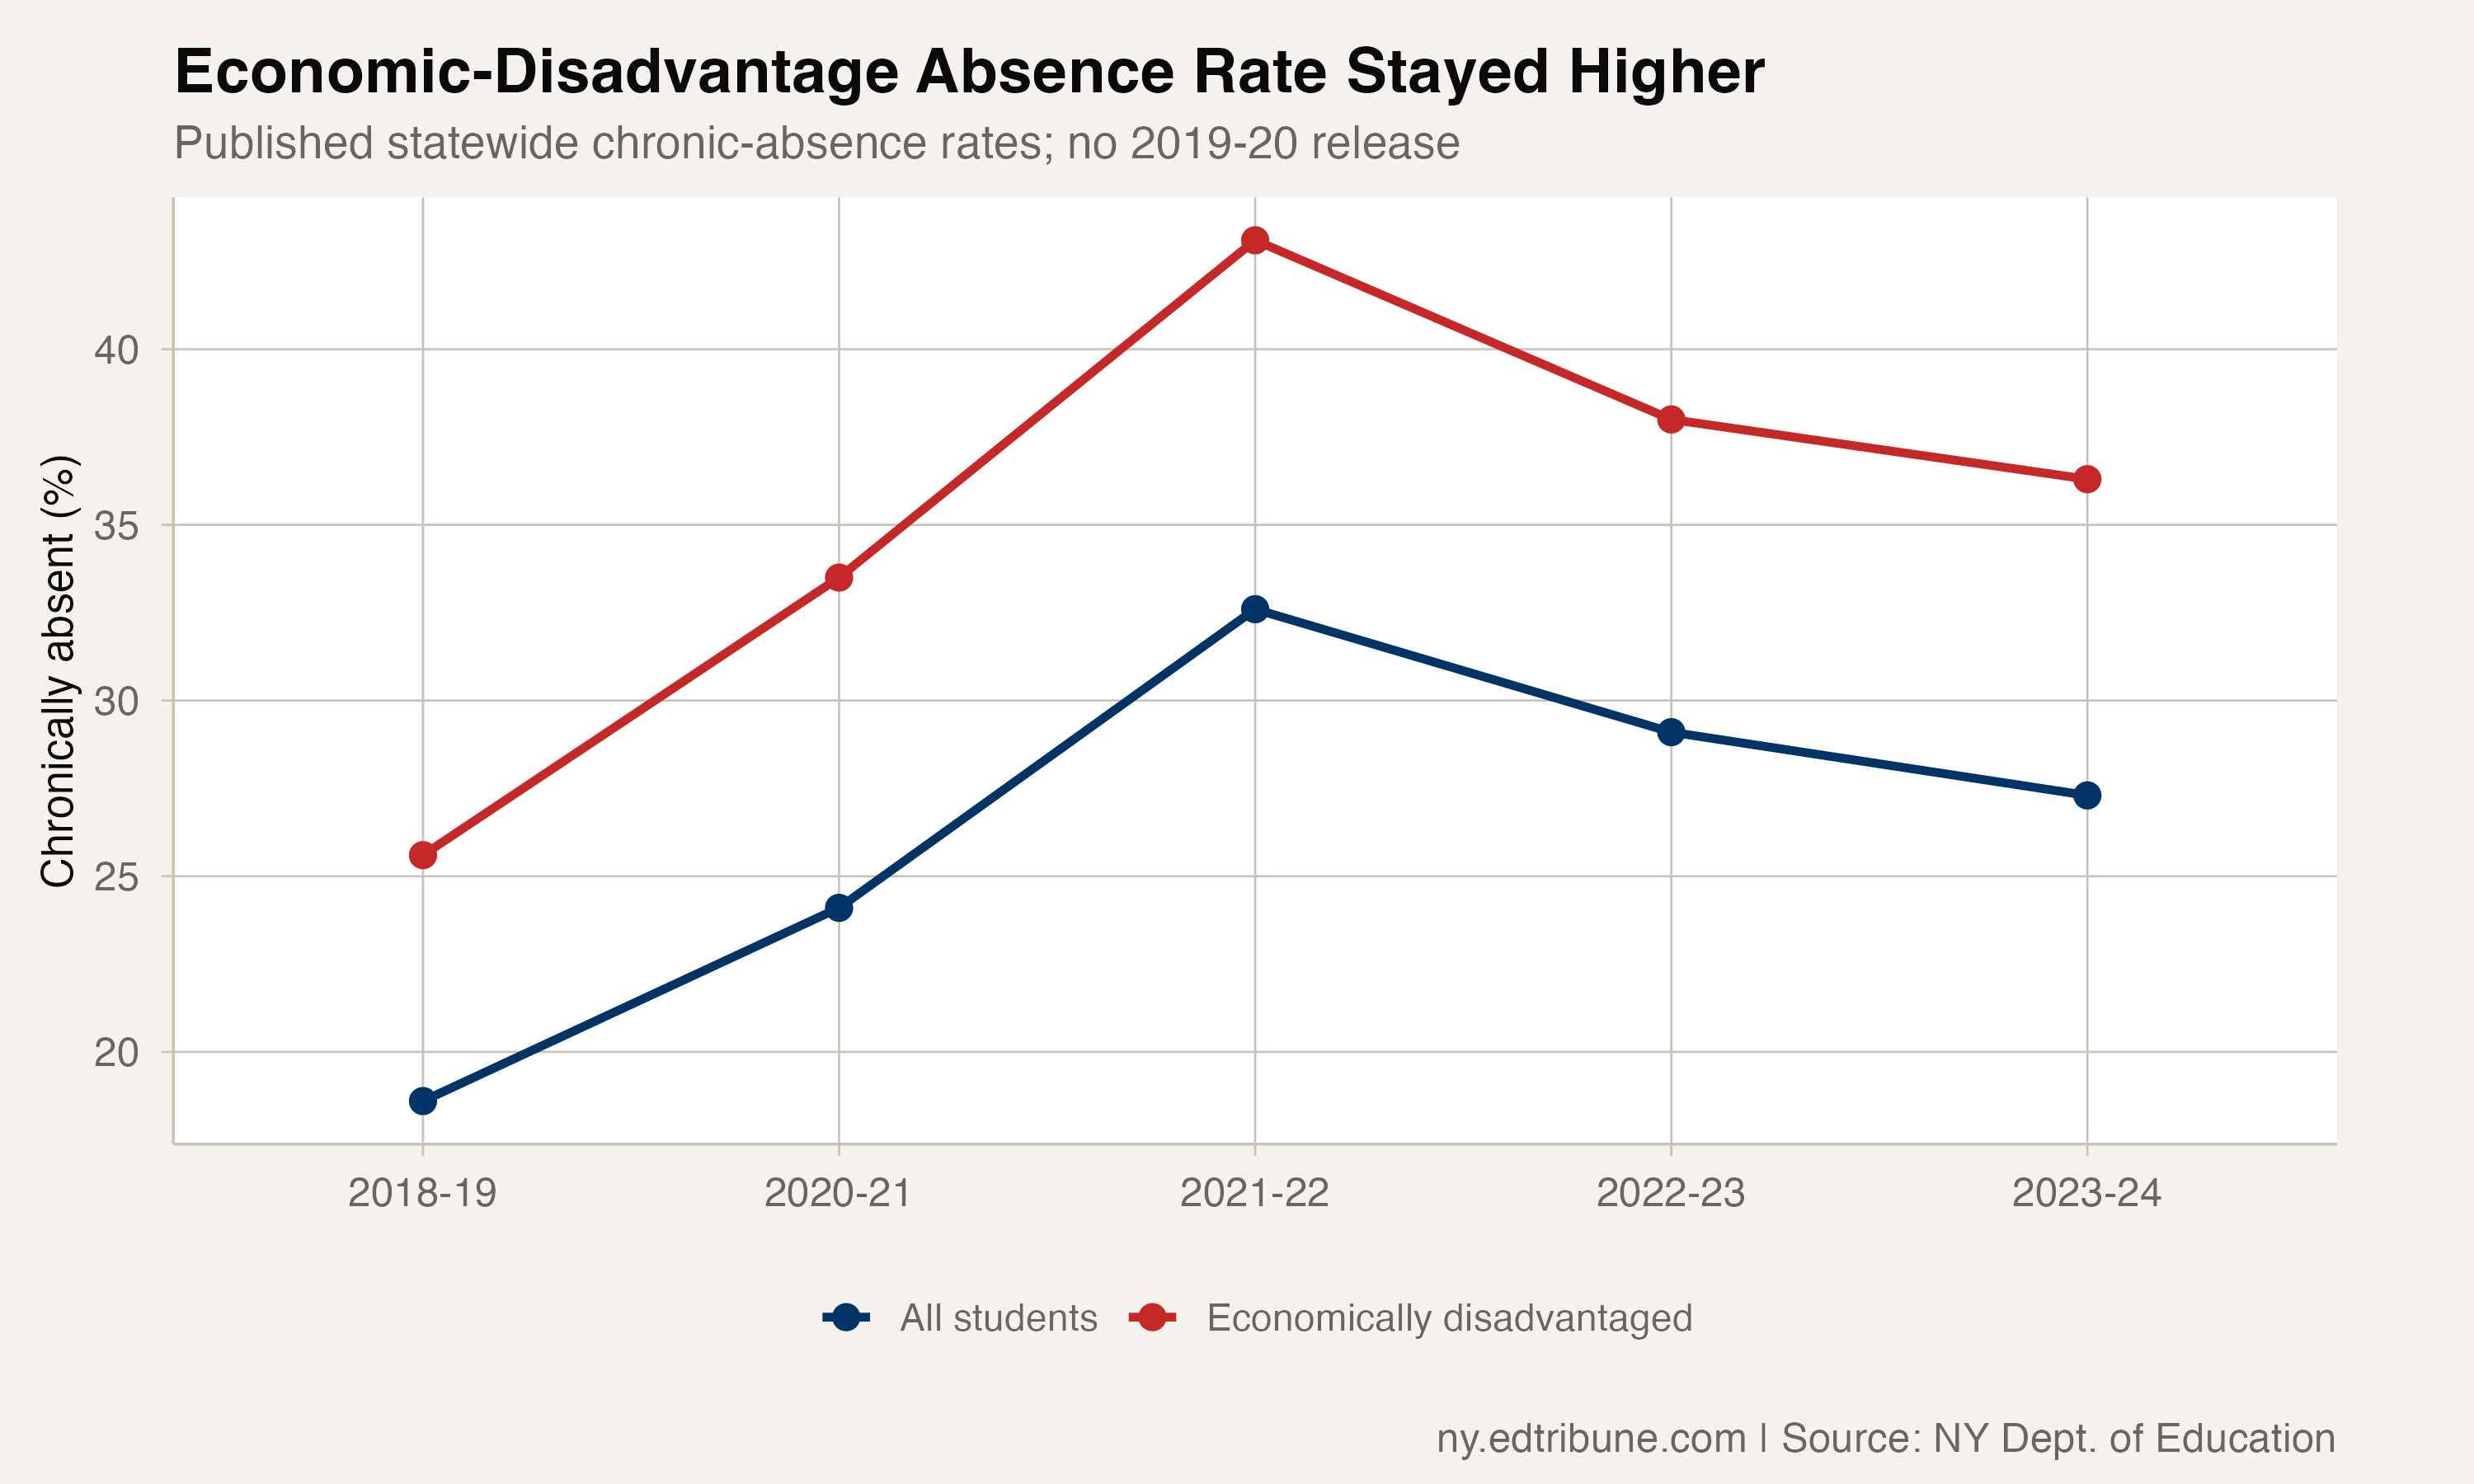
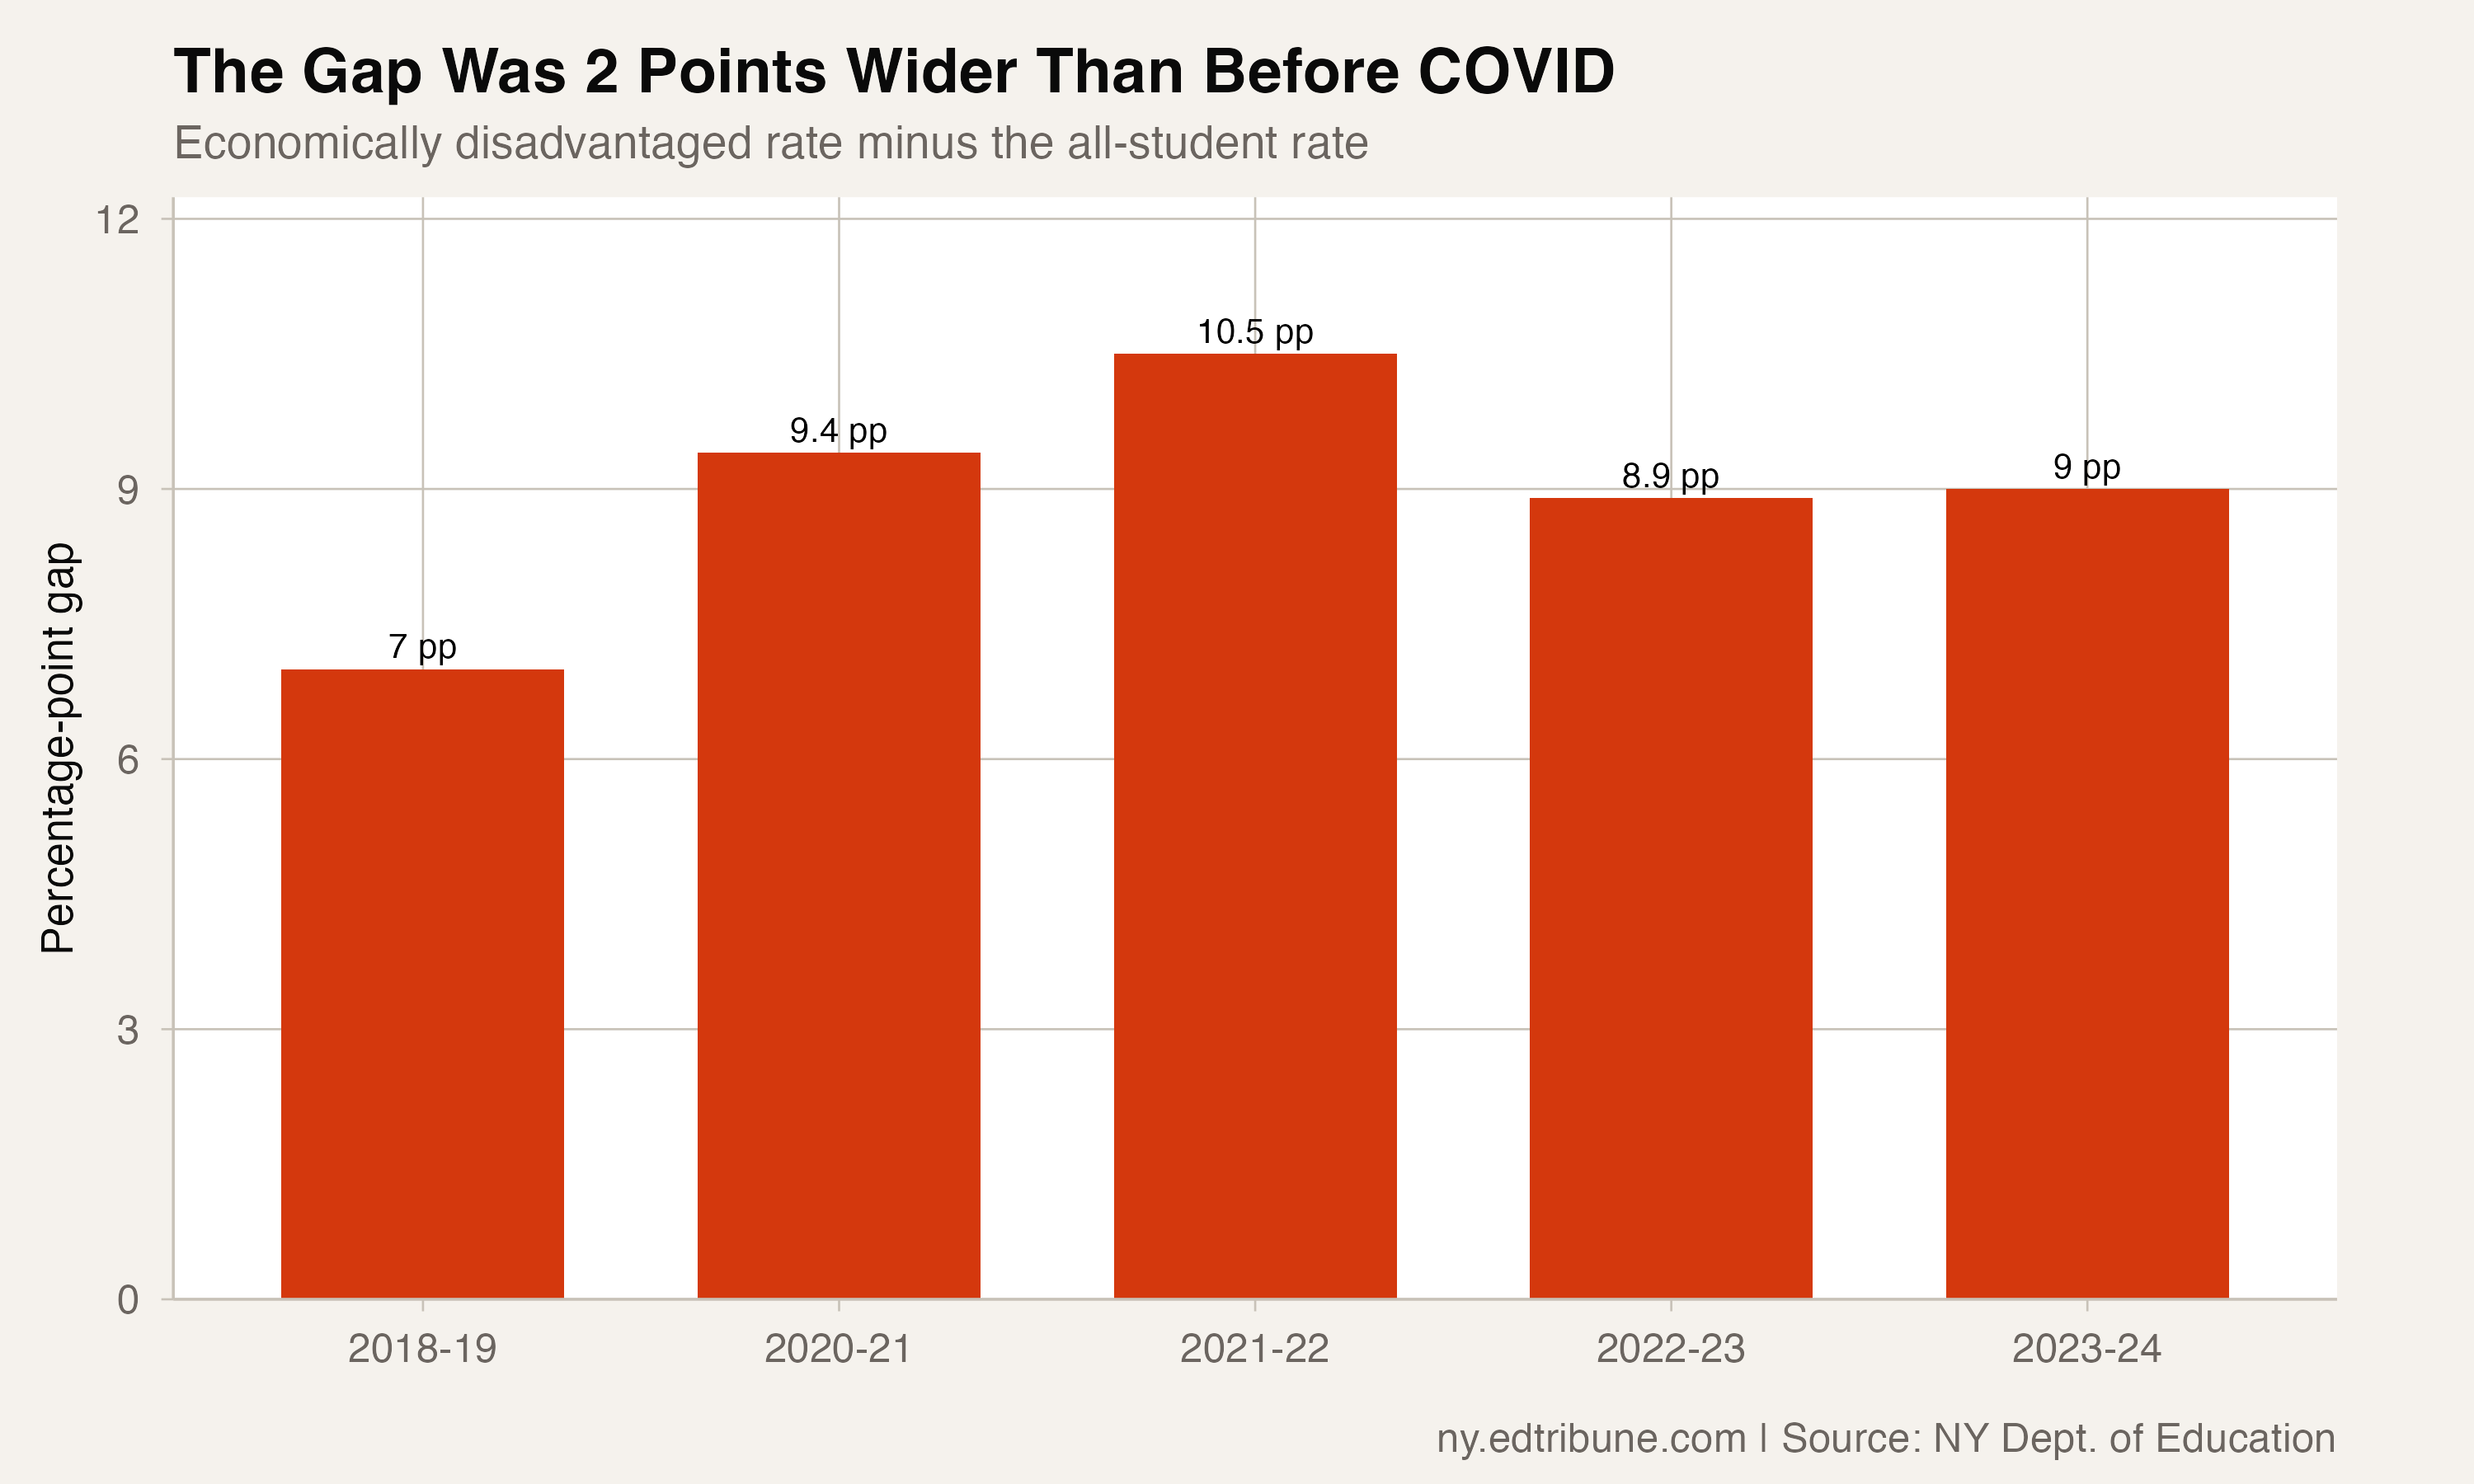
New York reported that 25.6% of economically disadvantaged students were chronically absent in 2018-19. The all-student rate was 18.6%, making the difference 7.0 percentage points.
In 2023-24, the economically disadvantaged rate was 36.3% and the all-student rate was 27.3%. The difference was 9.0 points—2.0 points wider than in 2018-19, a 28.6% increase in the size of the gap.
The gap peaked in 2021-22
The state package contains five comparable reports: 2018-19 and 2020-21 through 2023-24. New York did not publish a 2019-20 chronic-absence release.
The gap was 9.4 points in 2020-21, reached 10.5 points in 2021-22, narrowed to 8.9 points in 2022-23, and then measured 9.0 points in 2023-24. At the 2021-22 peak, the economically disadvantaged rate was 43.1% and the all-student rate was 32.6%.
Nearly half a million economically disadvantaged students were chronically absent
In 2023-24, New York reported 491,218 chronically absent economically disadvantaged students among 1,353,385 enrolled students. The all-student totals were 625,173 chronically absent students among 2,286,110 enrolled students.
Economically disadvantaged students represented 59.2% of published statewide enrollment but 78.6% of the published chronically absent count. Both shares use the separately published all-student total as the denominator; neither is reconstructed from surviving demographic categories.
The 9.0-point figure is a comparison with the all-student average, which includes economically disadvantaged students. It is not the rate difference between economically disadvantaged and non-economically-disadvantaged students, because the source does not publish a complementary statewide subgroup in this extract.
Direct evidence: the published rates, counts, and denominators show that the economically disadvantaged-to-all-student gap was wider in 2023-24 than in 2018-19. Unresourced: the files do not establish why the gap changed or which policies caused the movement.
Data source: New York State Education Department School Report Card chronic-absence tables shipped as checksum-bound public artifacts.
Detailed code that reproduces the analysis and figures in this article is available exclusively to EdTribune subscribers.
Discussion
Sign in to join the discussion.
Loading comments...