New York's high school chronic absenteeism rate was 31.3% in 2024-25, compared with 24.6% at the elementary/middle level. The difference was 6.7 percentage points in the most recent published attendance files.
Both rates fell from their pandemic-era peaks. Both also remained above their pre-pandemic baselines. The smaller gap between older and younger students than before the pandemic reflects a larger lasting increase at the elementary/middle level, rather than a return to earlier attendance patterns.
A smaller gap than before the pandemic
In 2018-19, the high school rate was 24.5% and the elementary/middle rate was 15.6%. That put the difference at 8.9 points. By 2024-25, elementary/middle absenteeism was 9.0 points above that baseline, while the high school rate was 6.8 points higher.
These are statewide rates published separately for the two school levels. They compare annual student populations; they do not follow the same children as they move through school. The state's reporting guide describes the separate elementary/middle and high school attendance measures.
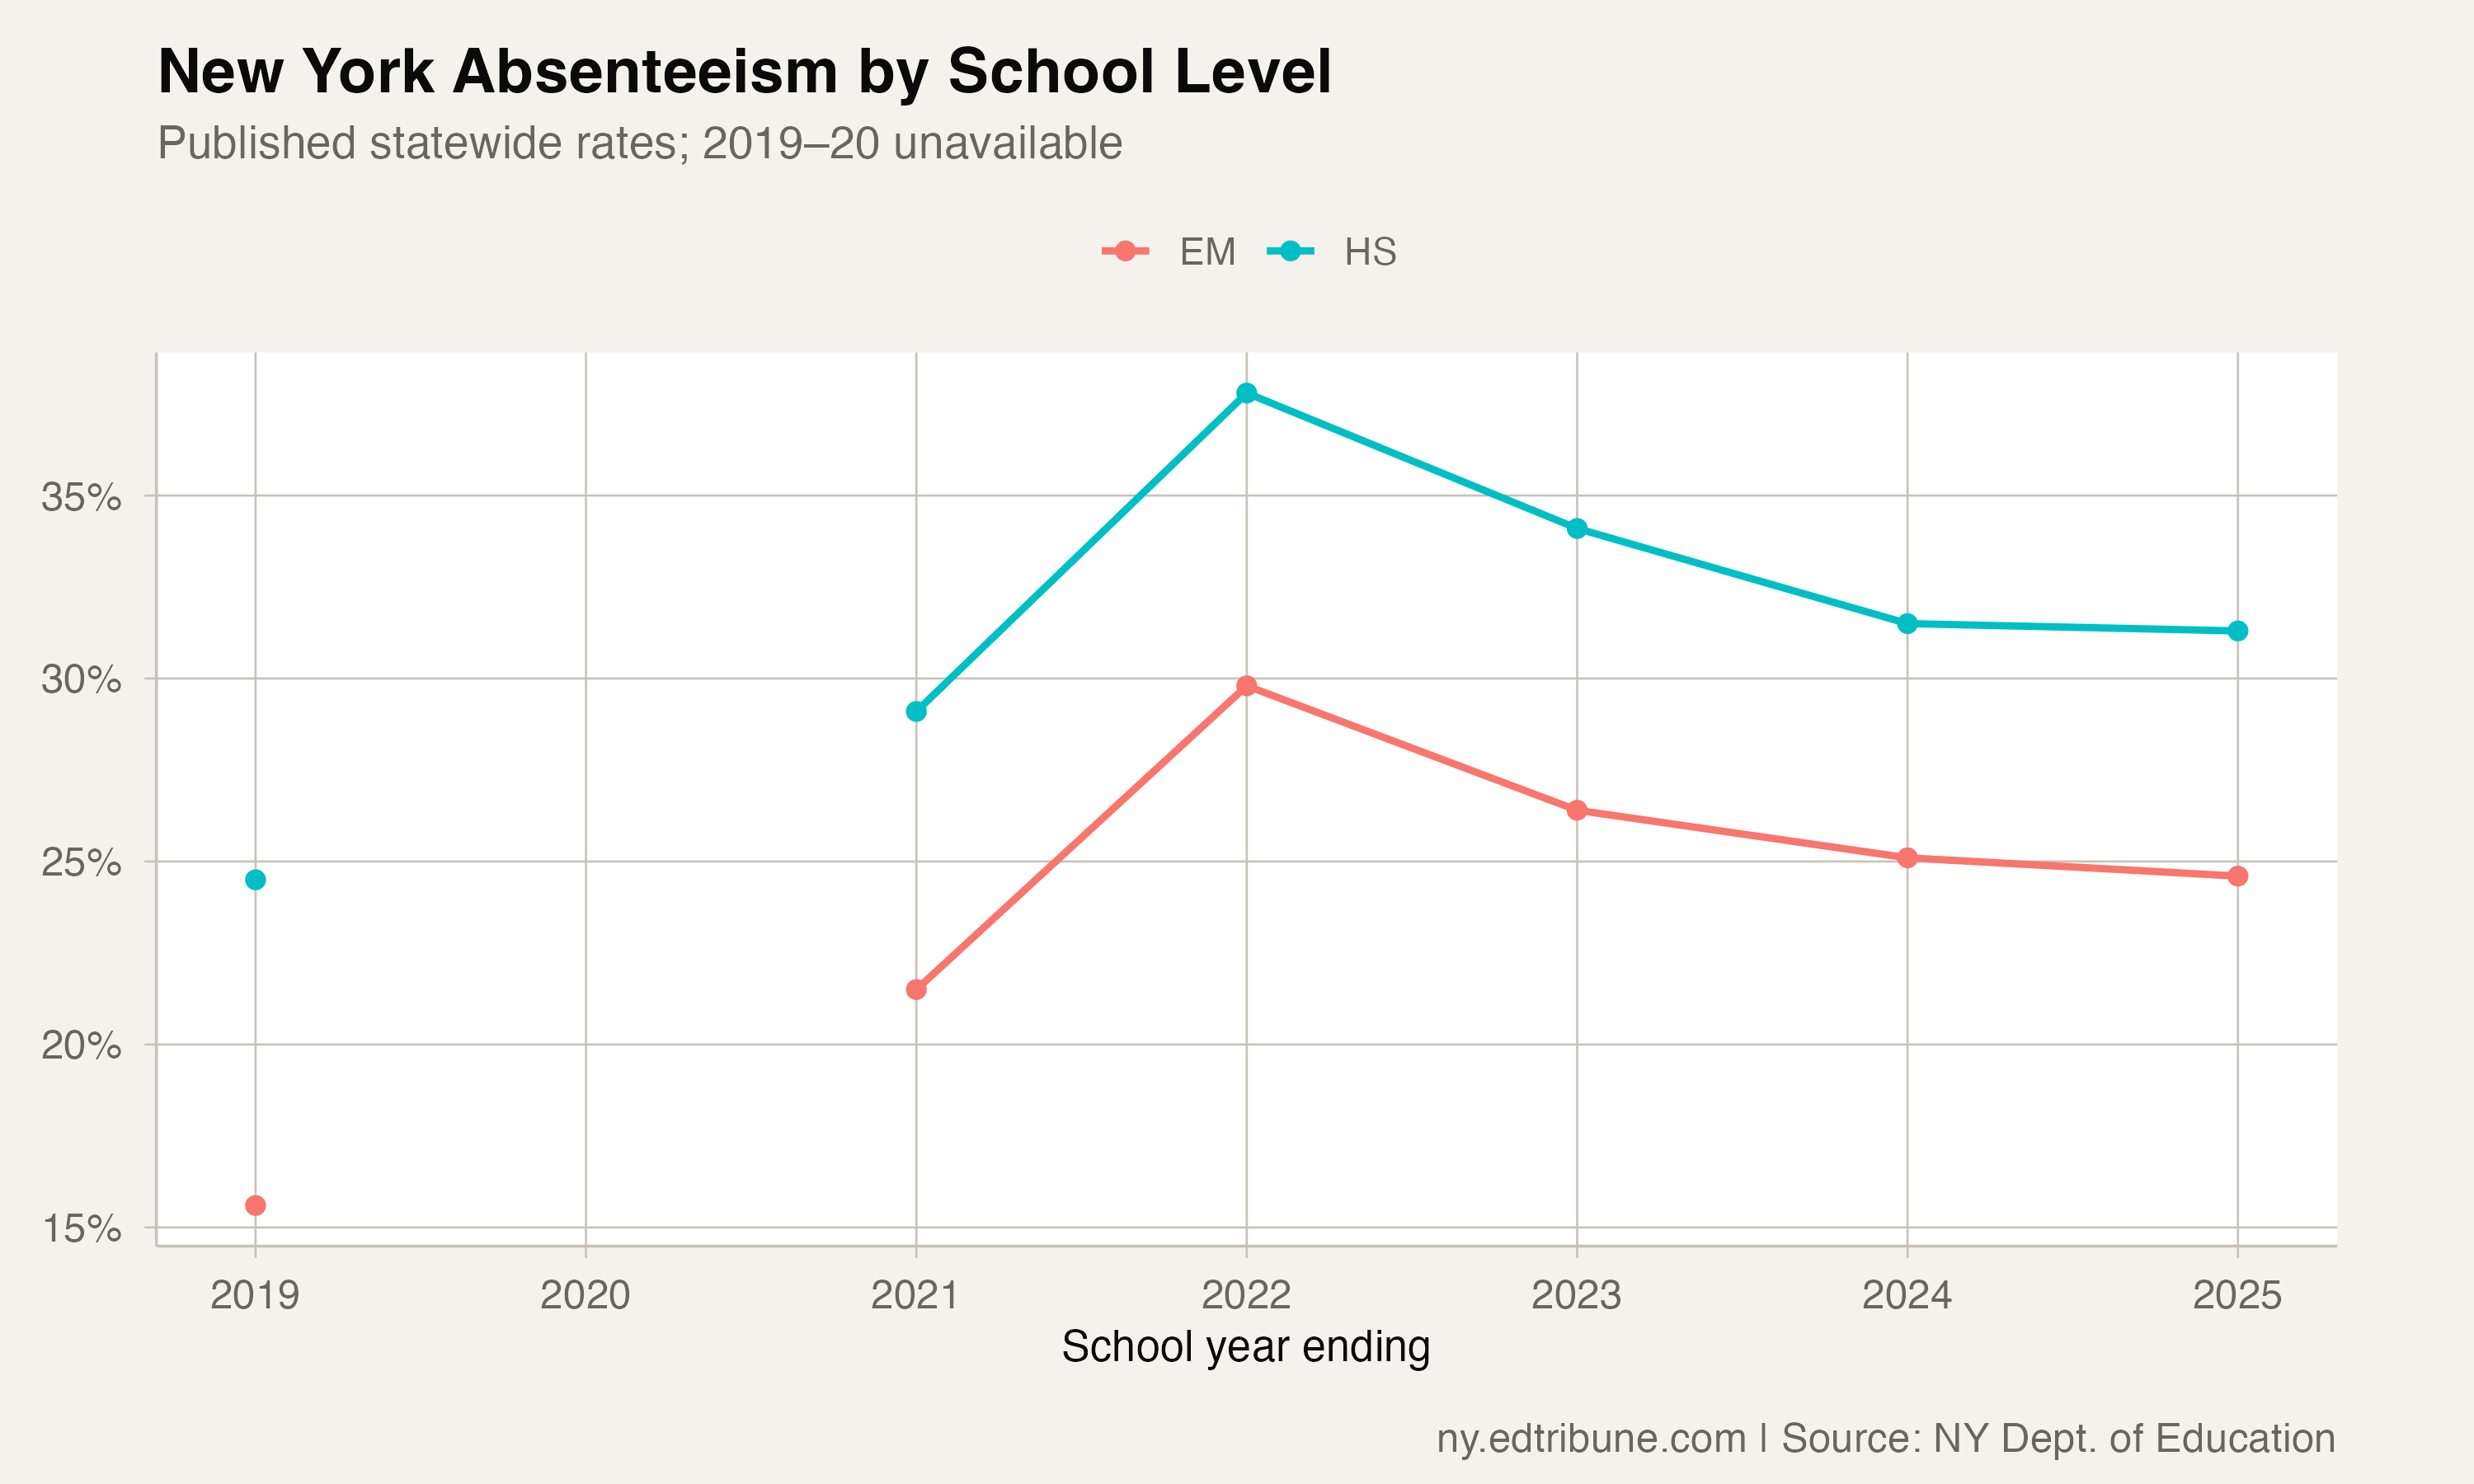
High school absenteeism exceeded elementary/middle absenteeism in all six available reporting years. There is no comparable observation for 2019-20 in this series. The break in the chart marks that missing year rather than treating it as an attendance improvement.
Recovery continued, but slowed
Both levels reached their highest rates in the available series in 2021-22: 37.8% in high school and 29.8% in elementary/middle school. Through 2024-25, those rates fell by 6.5 and 5.2 points, respectively.
The last annual step was smaller. Between 2023-24 and 2024-25, the high school rate fell from 31.5% to 31.3%, a decline of 0.2 points. The elementary/middle rate fell from 25.1% to 24.6%, down 0.5 points. Consequently, the gap widened in that final year even though attendance improved at both levels.
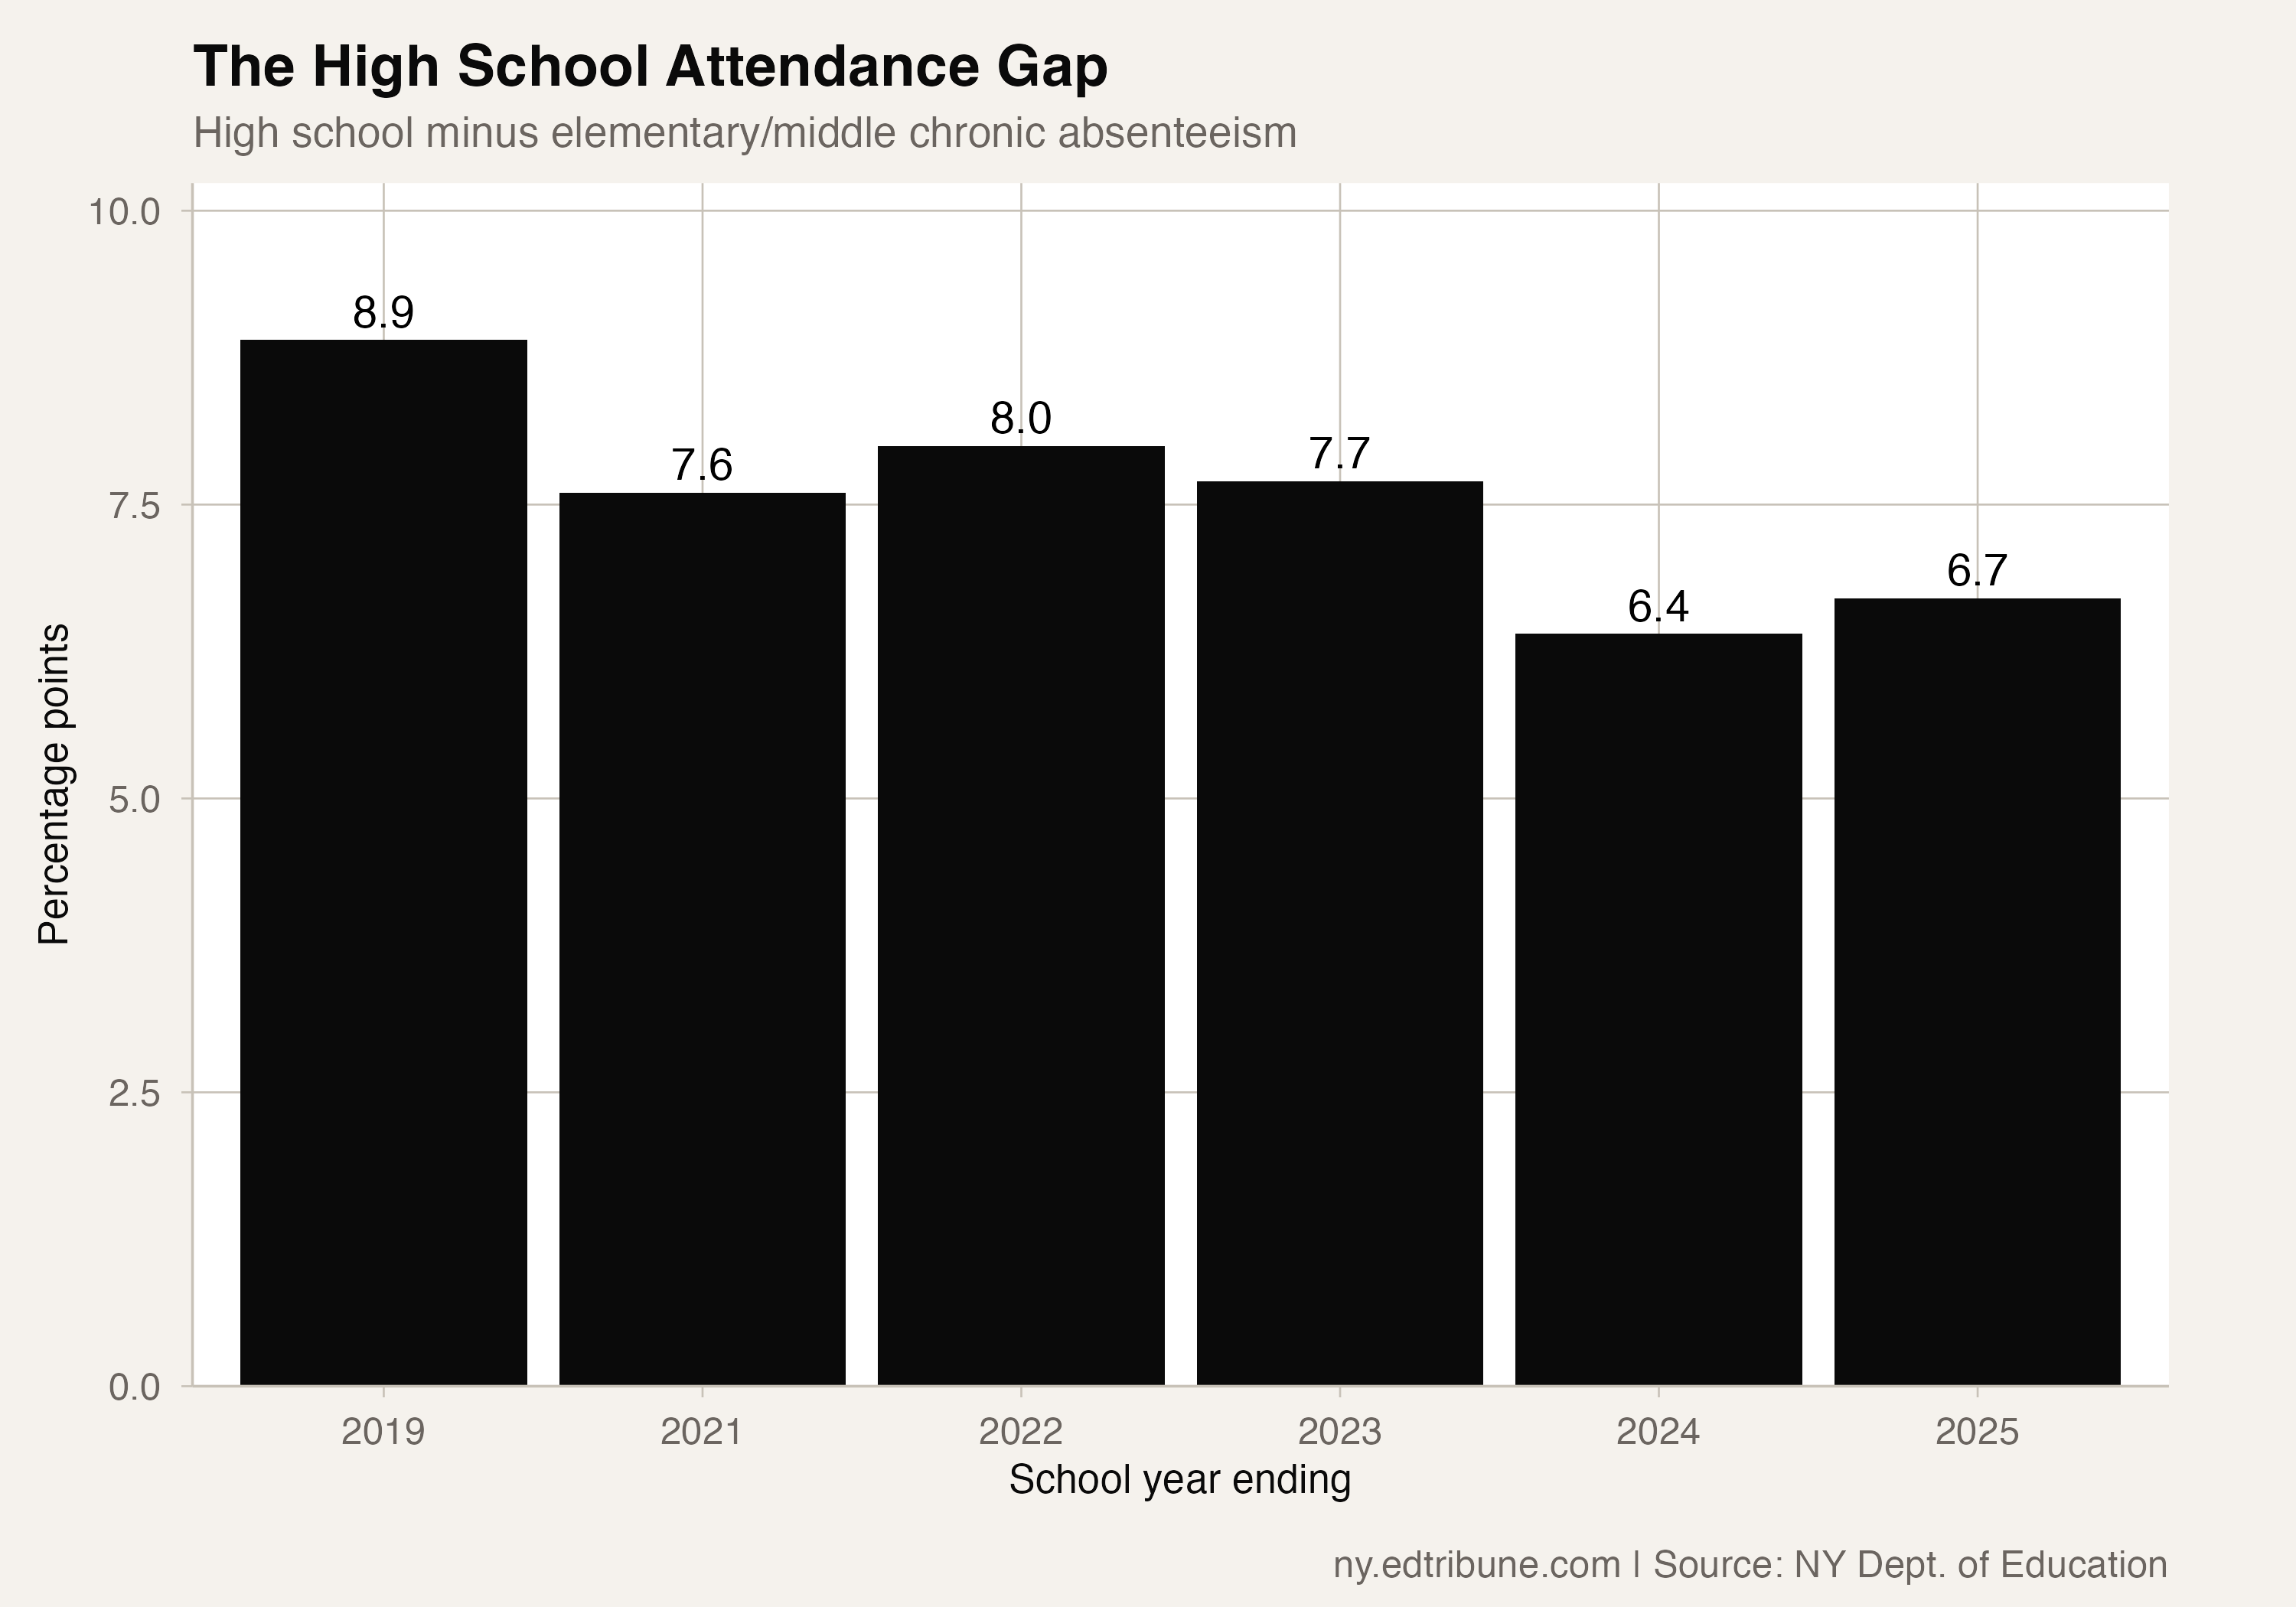
The long-term narrowing and the most recent widening answer different questions. Relative to the pre-pandemic baseline, younger students still had the larger increase. Relative to the preceding year, younger students made the larger improvement. Neither comparison supports a forecast that the two rates will converge.
High school subgroup rates remained uneven
In 2024-25, high school chronic absenteeism was 41.2% for Black students, 40.6% for English learners, 40.6% for students with disabilities, 40.4% for economically disadvantaged students, and 39.4% for Hispanic students. The rate for White students was 23.0%.
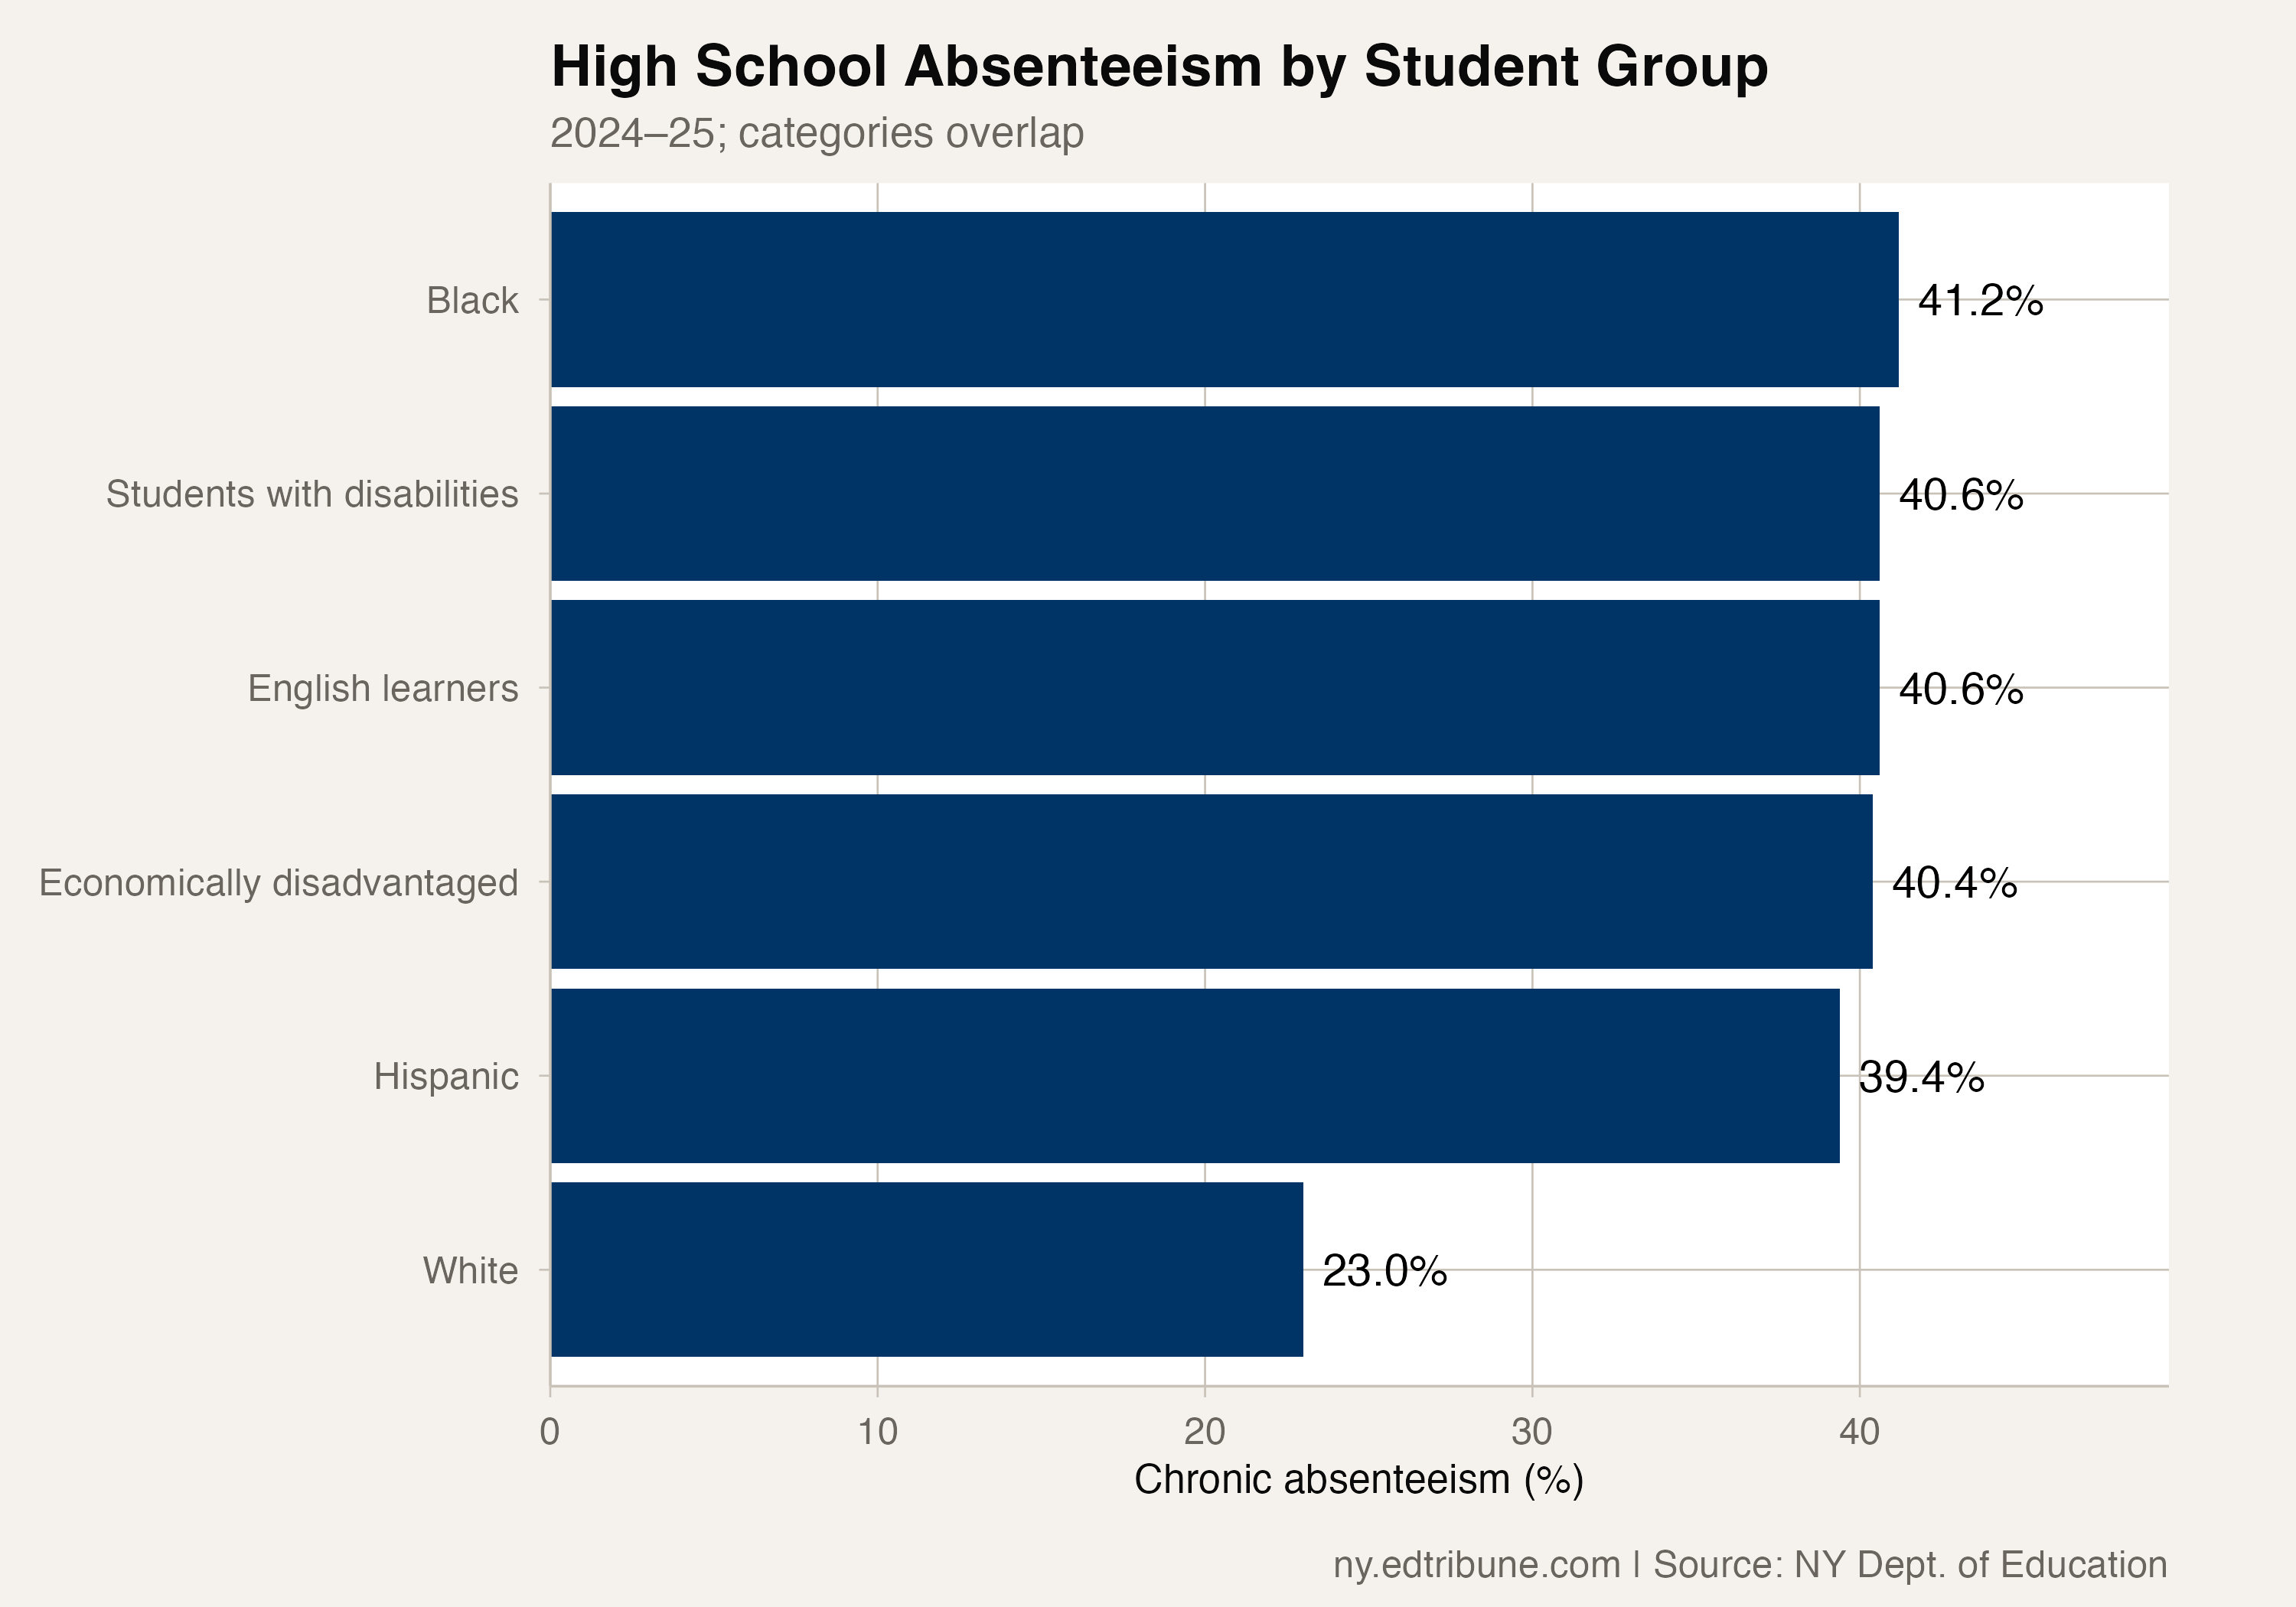
These categories overlap. The state figures do not provide an intersectional rate for students who belong to several of them, so the individual subgroup rates cannot be added together to estimate a combined risk. They also do not establish which circumstances caused students to miss school.
The published series shows improvement since the peak, alongside a remaining gap from pre-pandemic attendance at both school levels. It does not identify which students recovered, which interventions helped, or what happened to students after they left these annual reporting groups.
Detailed code that reproduces the analysis and figures in this article is available exclusively to EdTribune subscribers.
Discussion
Sign in to join the discussion.
Loading comments...