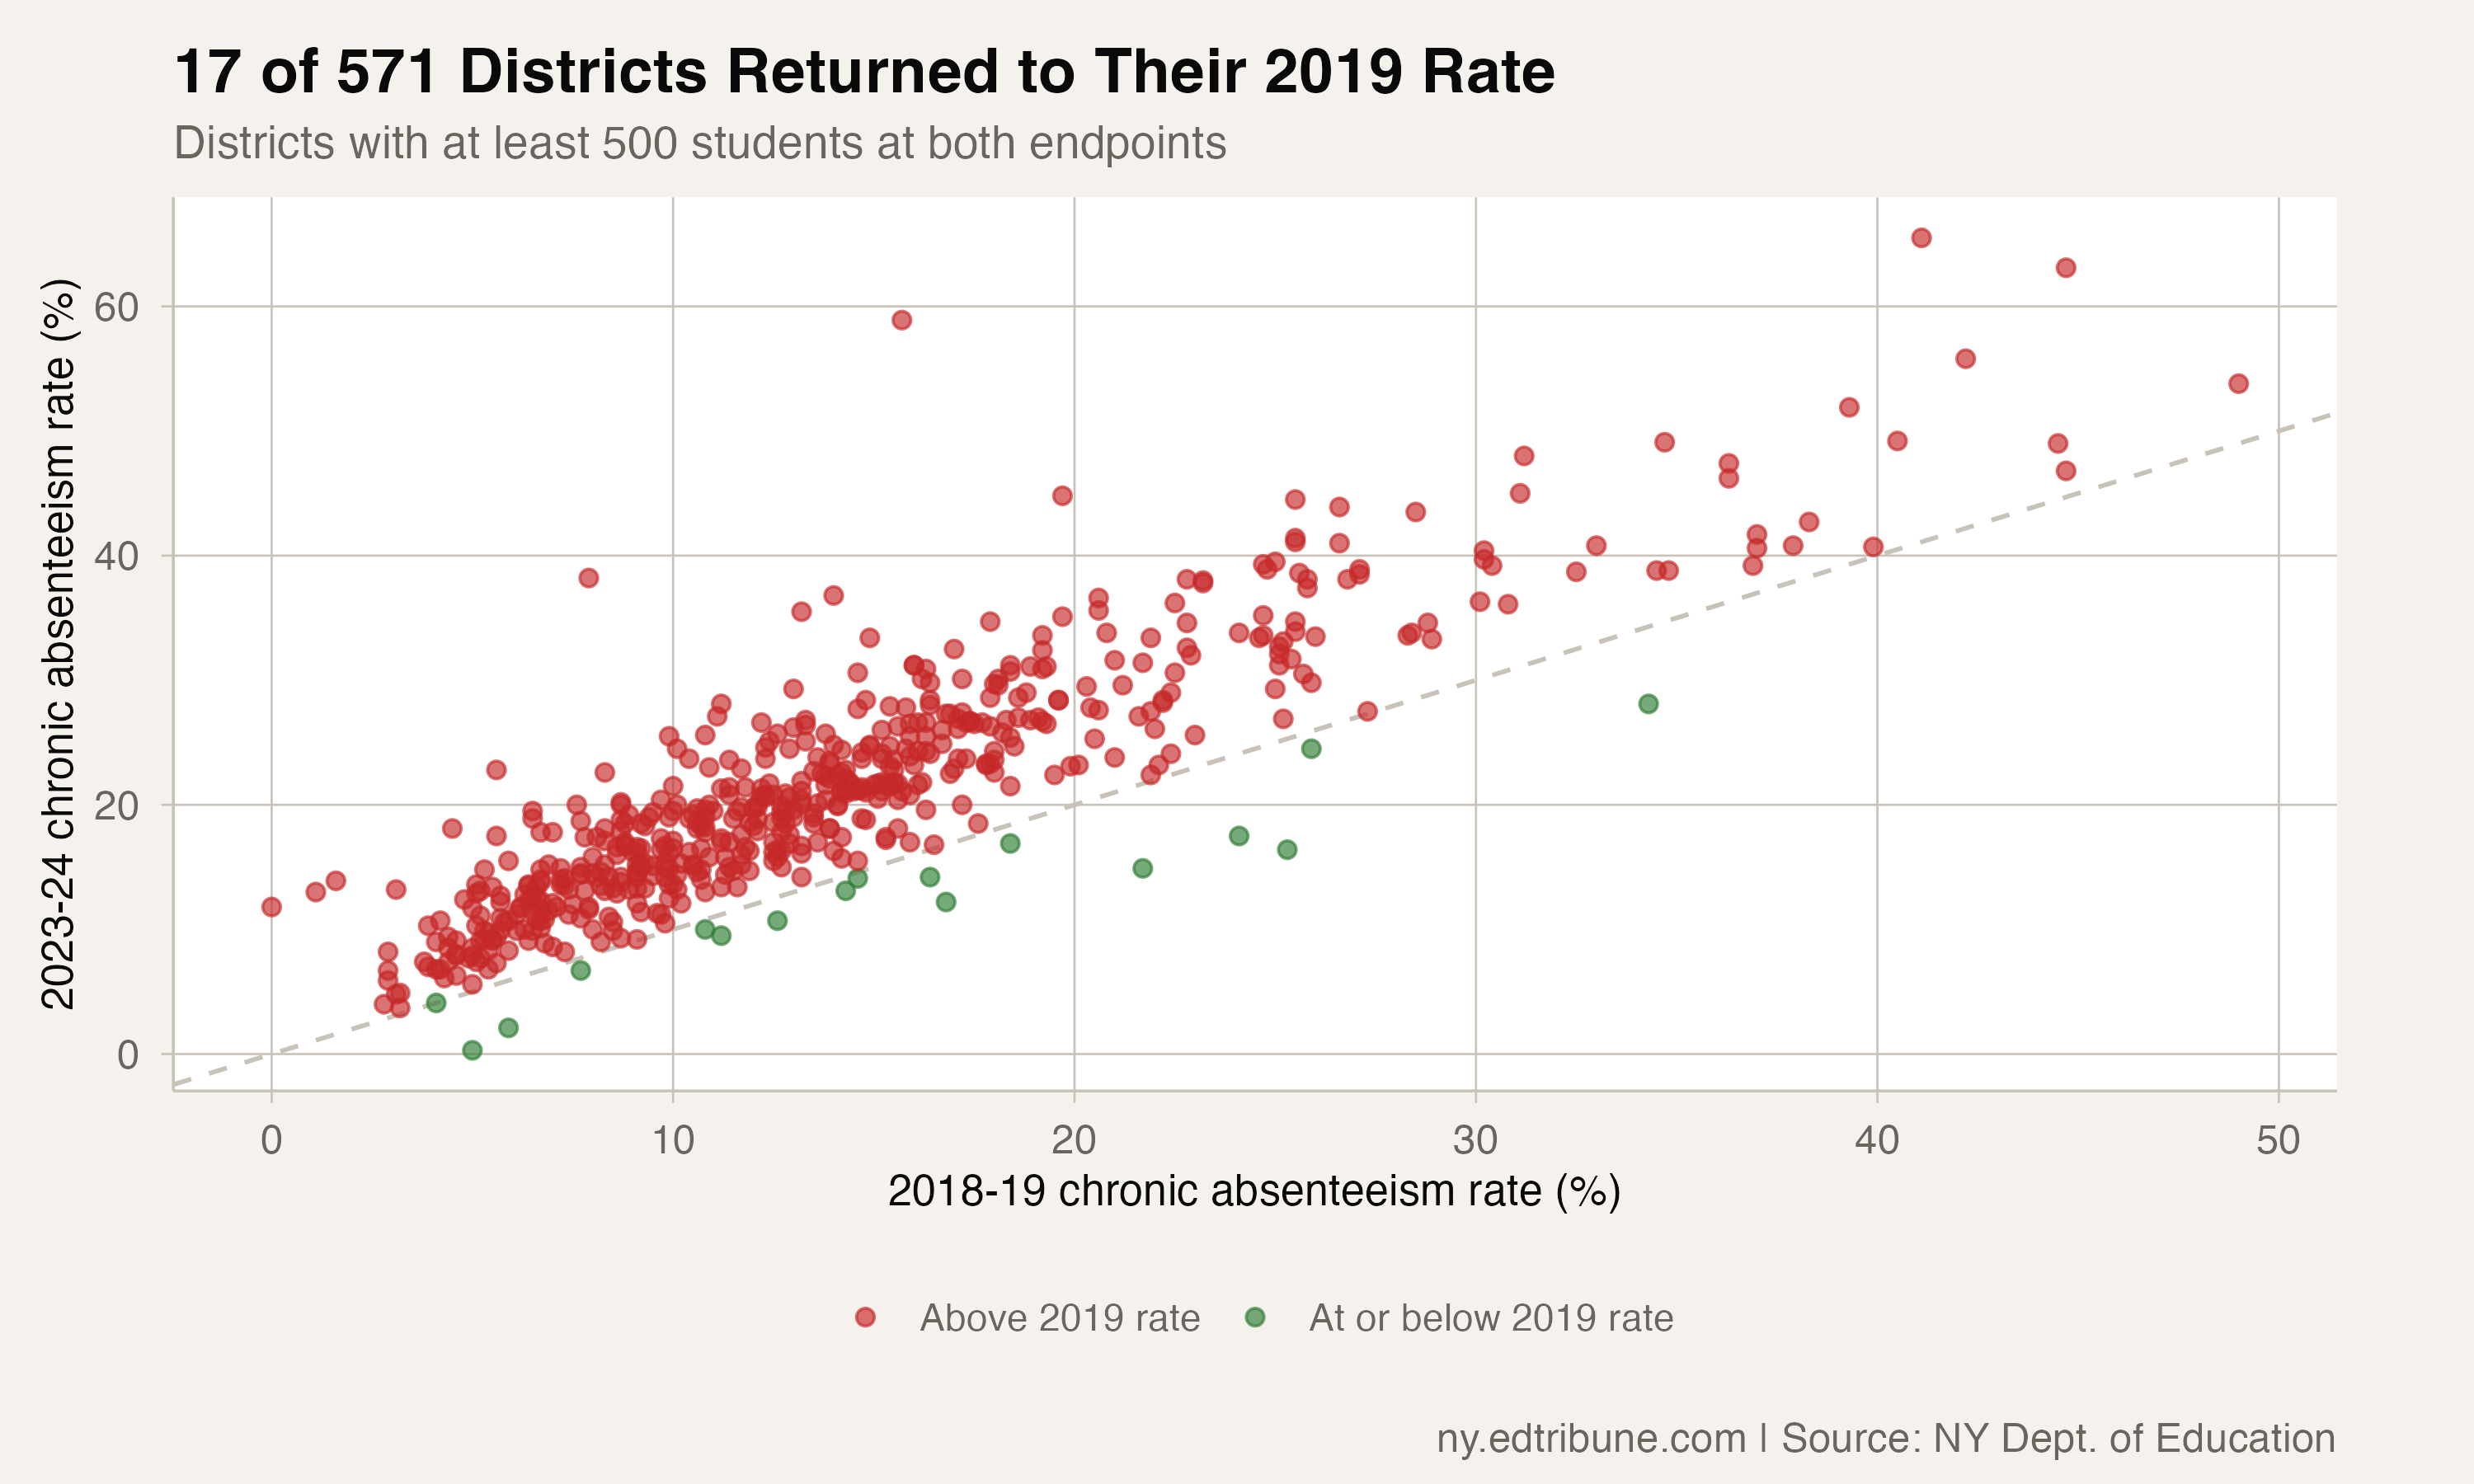
Among 571 New York districts with at least 500 students in both 2018-19 and 2023-24, only 17 had a chronic absenteeism rate at or below their 2019 rate in 2024. That was 3.0% of the fixed district universe. The other 554 districts, or 97.0%, remained above their 2019 rate.
The statewide rate improved from its peak
New York's statewide chronic absenteeism rate was 18.7% in 2019, reached 31.7% in 2022, and fell to 26.2% in 2024. The 2024 rate remained 7.5 percentage points above 2019.
In 2024, the state reported 560,679 chronically absent students among 2,141,093 enrolled students.
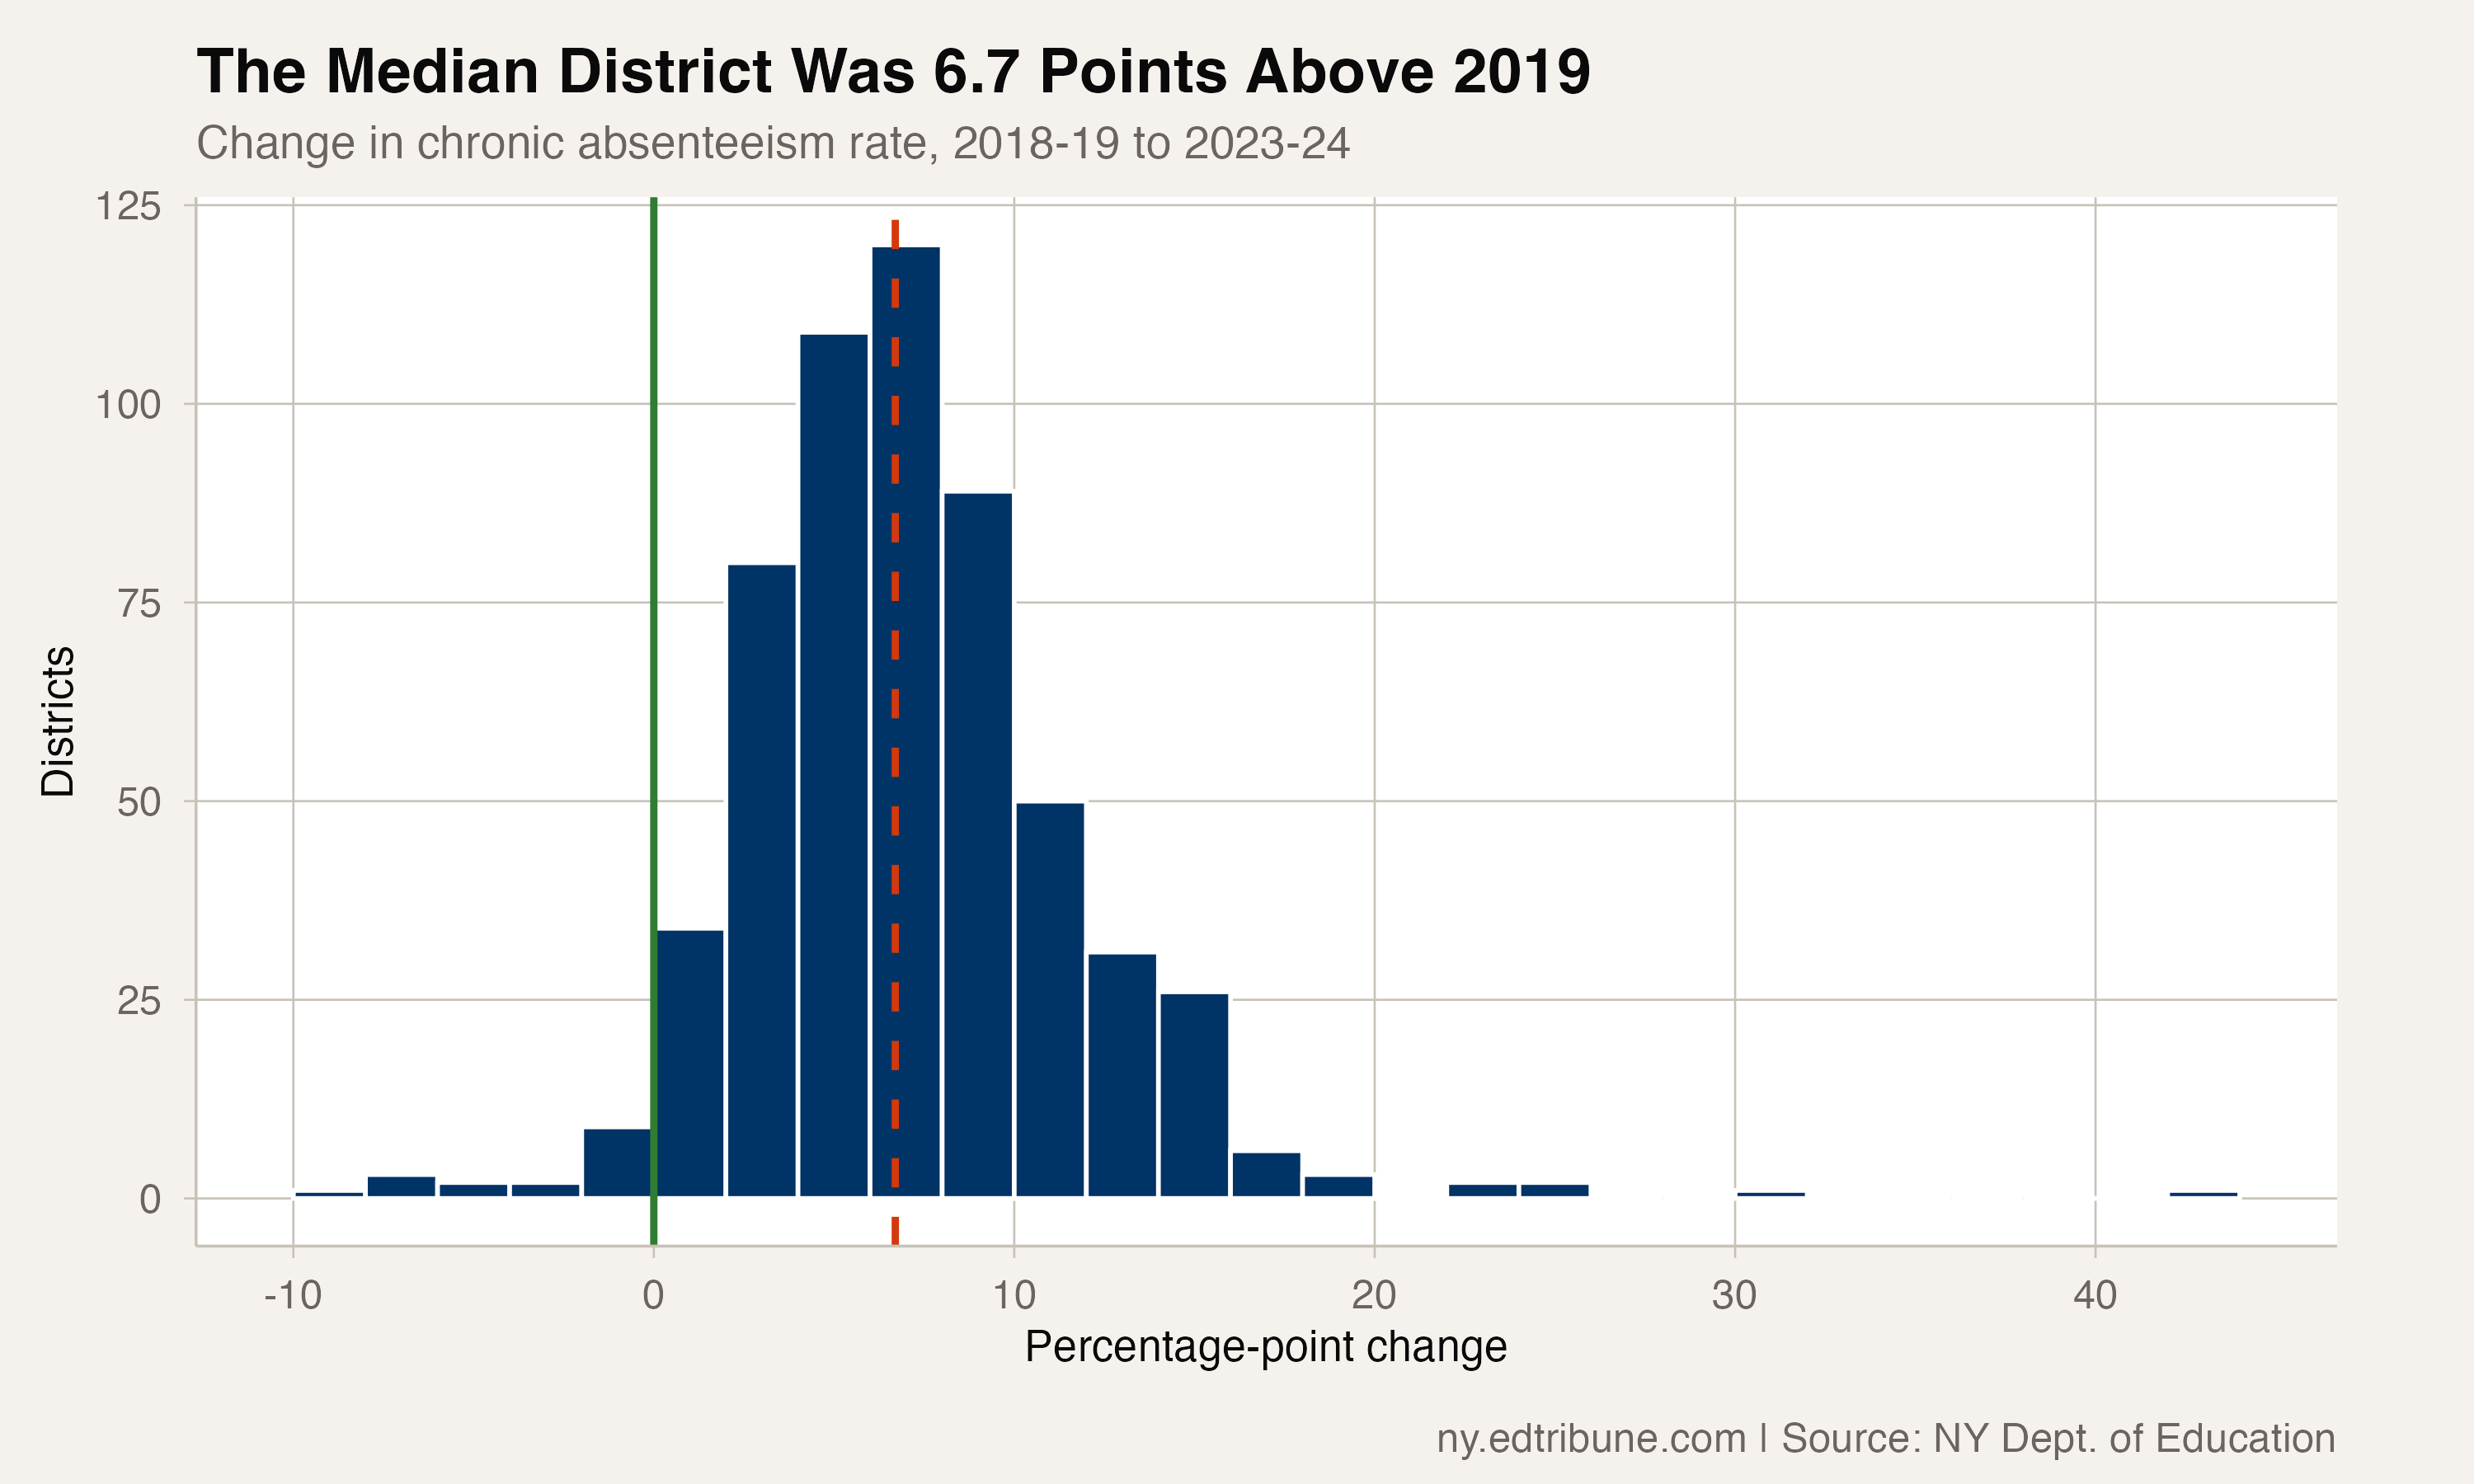
At the district level, the median change was an increase of 6.7 points. A total of 124 districts were at least 10 percentage points above their 2019 rate.
The 17 districts at or below 2019
Cooperstown Central School District↗ET fell from 25.3% in 2019 to 16.4% in 2024, an 8.9-point decline. Oceanside Union Free School District↗ET fell from 5.0% to 0.3%; the 2024 file reported 16 chronically absent students among 4,962 enrolled students.
Mount Vernon City School District↗ET fell from 25.9% to 24.5%. It was the only recovered district with at least 5,000 students in 2024.
Large-district increases
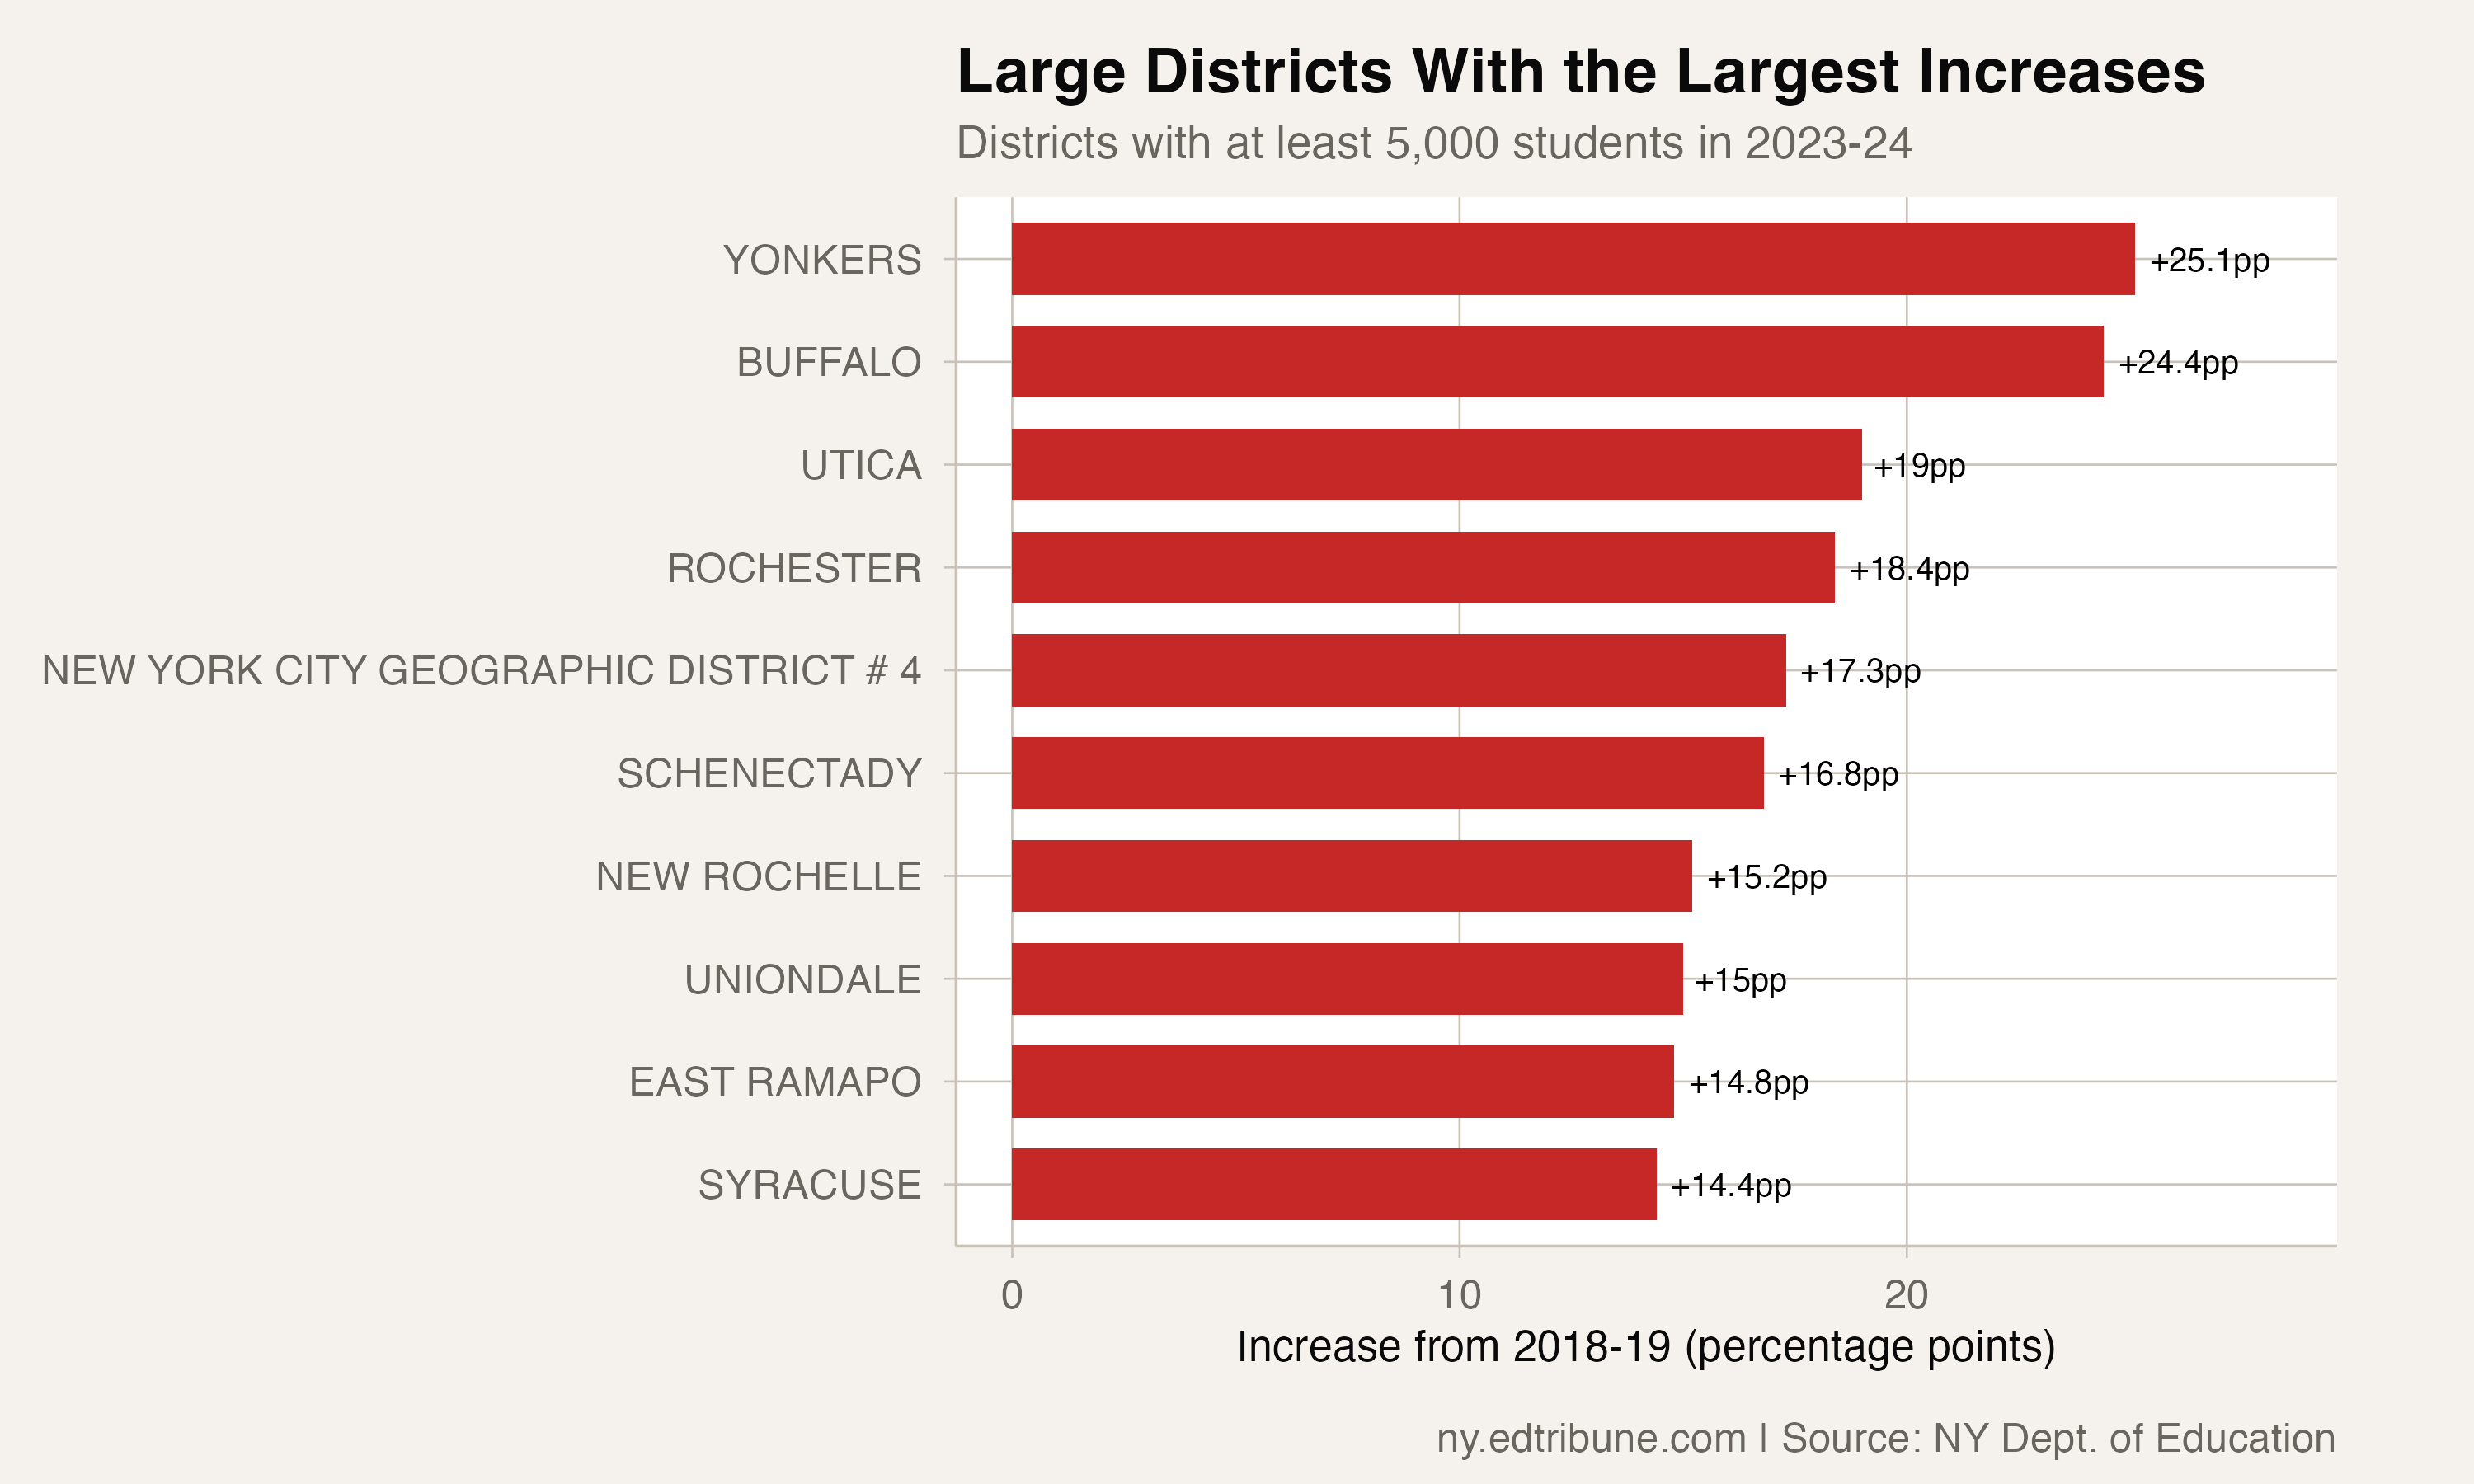
Among districts with at least 5,000 students in 2024, Yonkers↗ET had the largest increase, from 19.7% to 44.8%, or 25.1 points. Buffalo↗ET rose from 41.1% to 65.5%, a 24.4-point increase. Utica↗ET rose from 25.5% to 44.5%, up 19.0 points, and Rochester↗ET rose from 44.7% to 63.1%, up 18.4 points.
What the data does not establish
The files establish the fixed-universe comparison, statewide trend, and district rates. They do not identify which policy, district practice, family condition, or pandemic-era change caused any district's result. Those mechanisms are unresourced here and have been removed from the earlier draft.
Rates and counts come from New York State Education Department files.
Detailed code that reproduces the analysis and figures in this article is available exclusively to EdTribune subscribers.
Discussion
Sign in to join the discussion.
Loading comments...